Listing History
Unit Highlights
Maintenance Fees
Utility Type
- Air Conditioning
- Central Air
- Heat Source
- Electric
- Heating
- Heat Pump
Room Dimensions
About this Listing
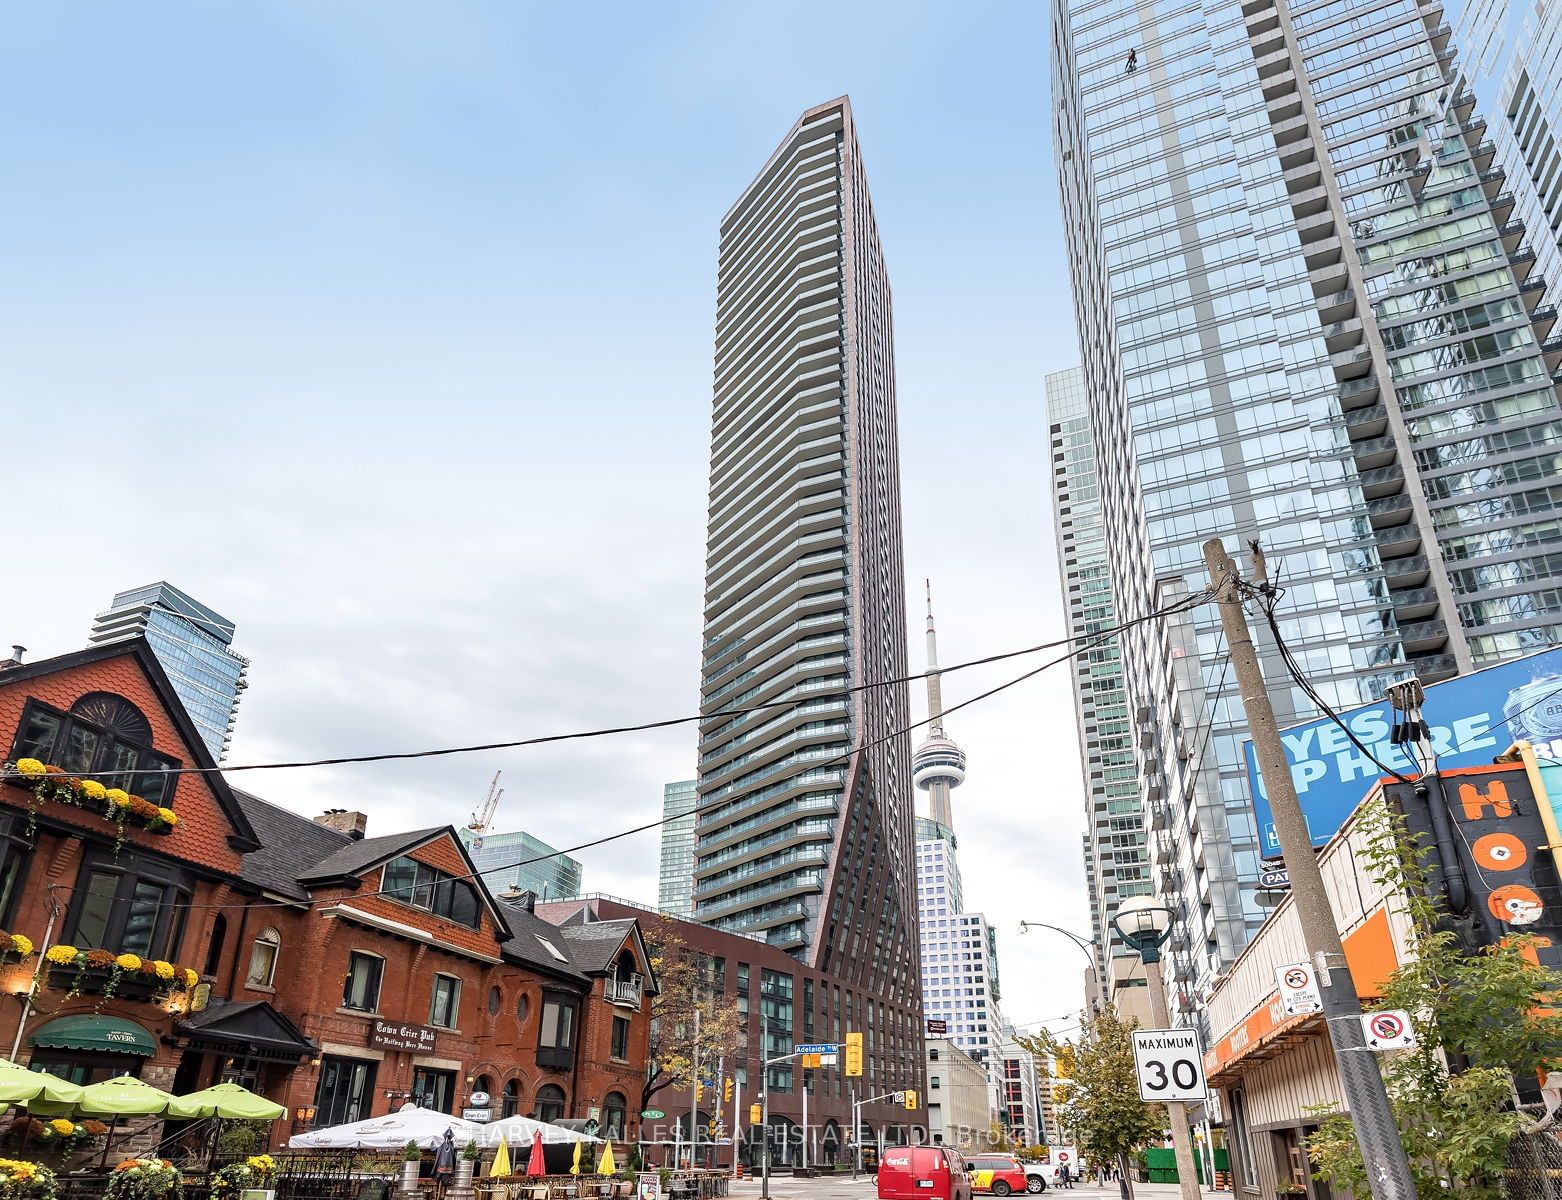
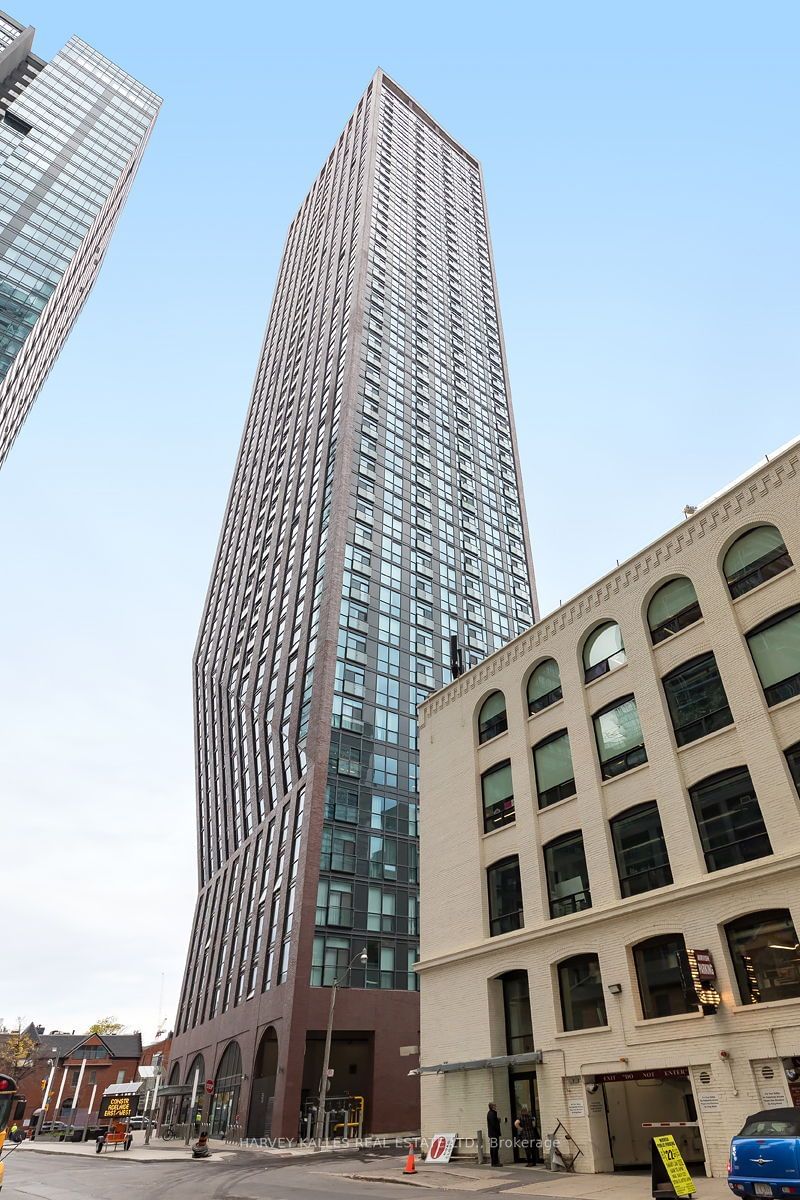
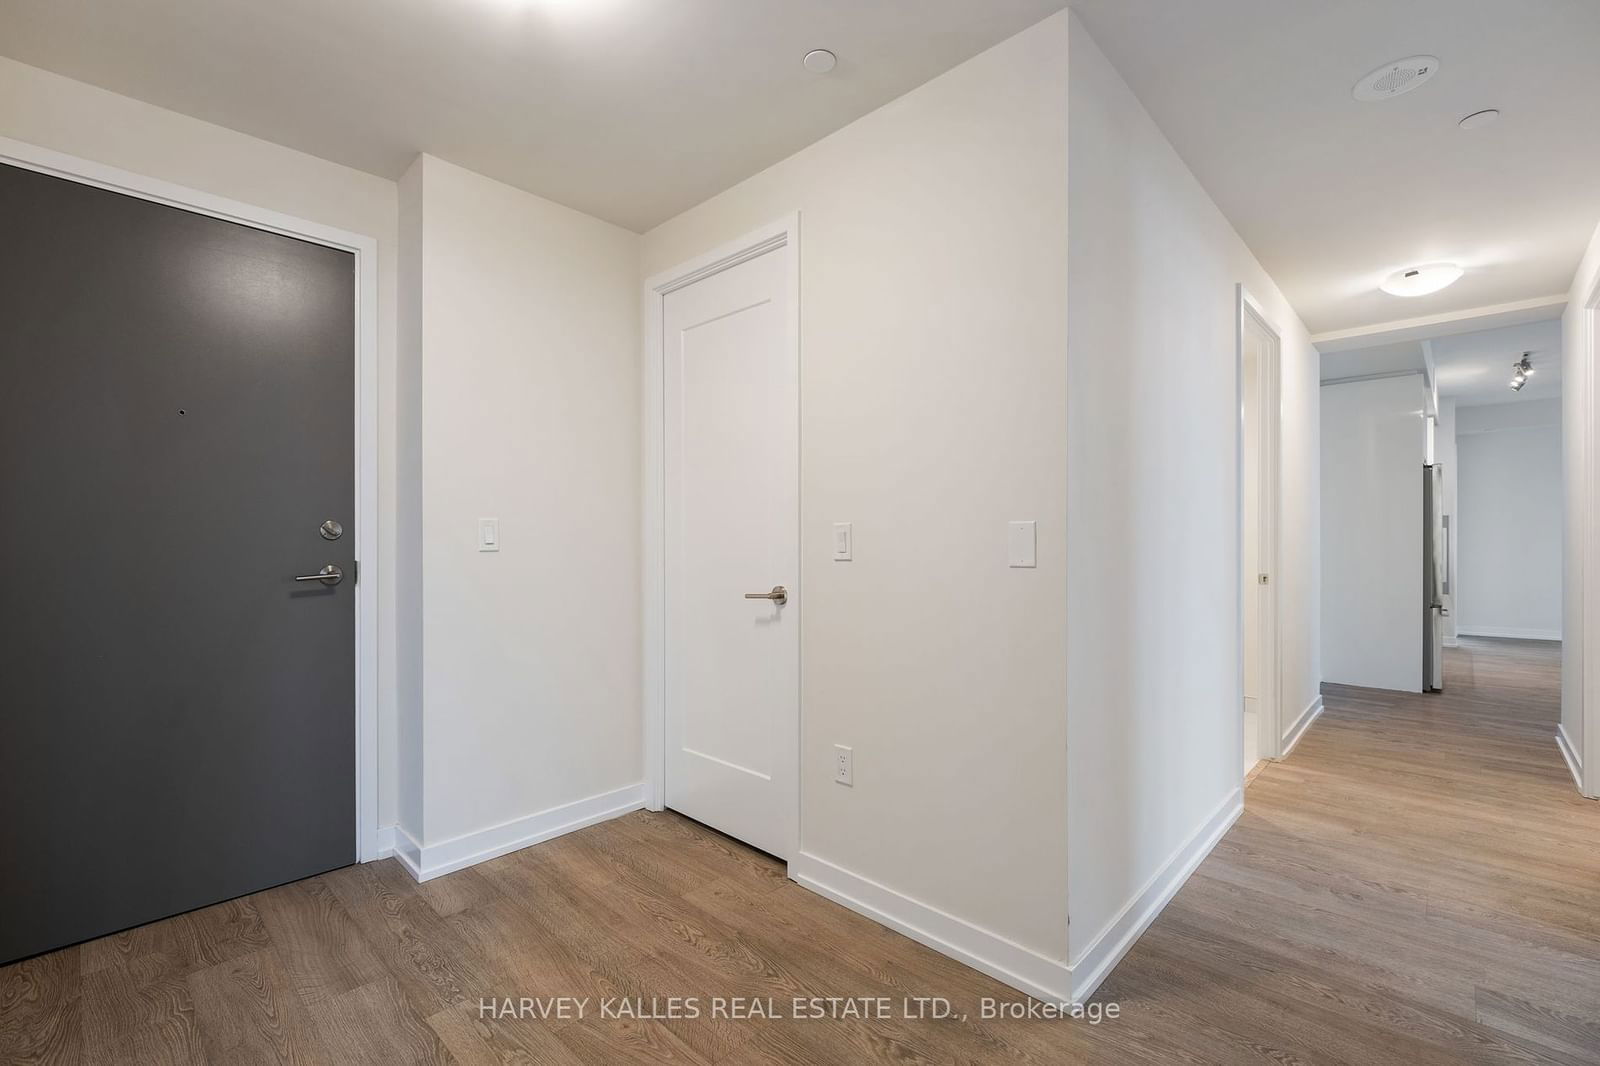
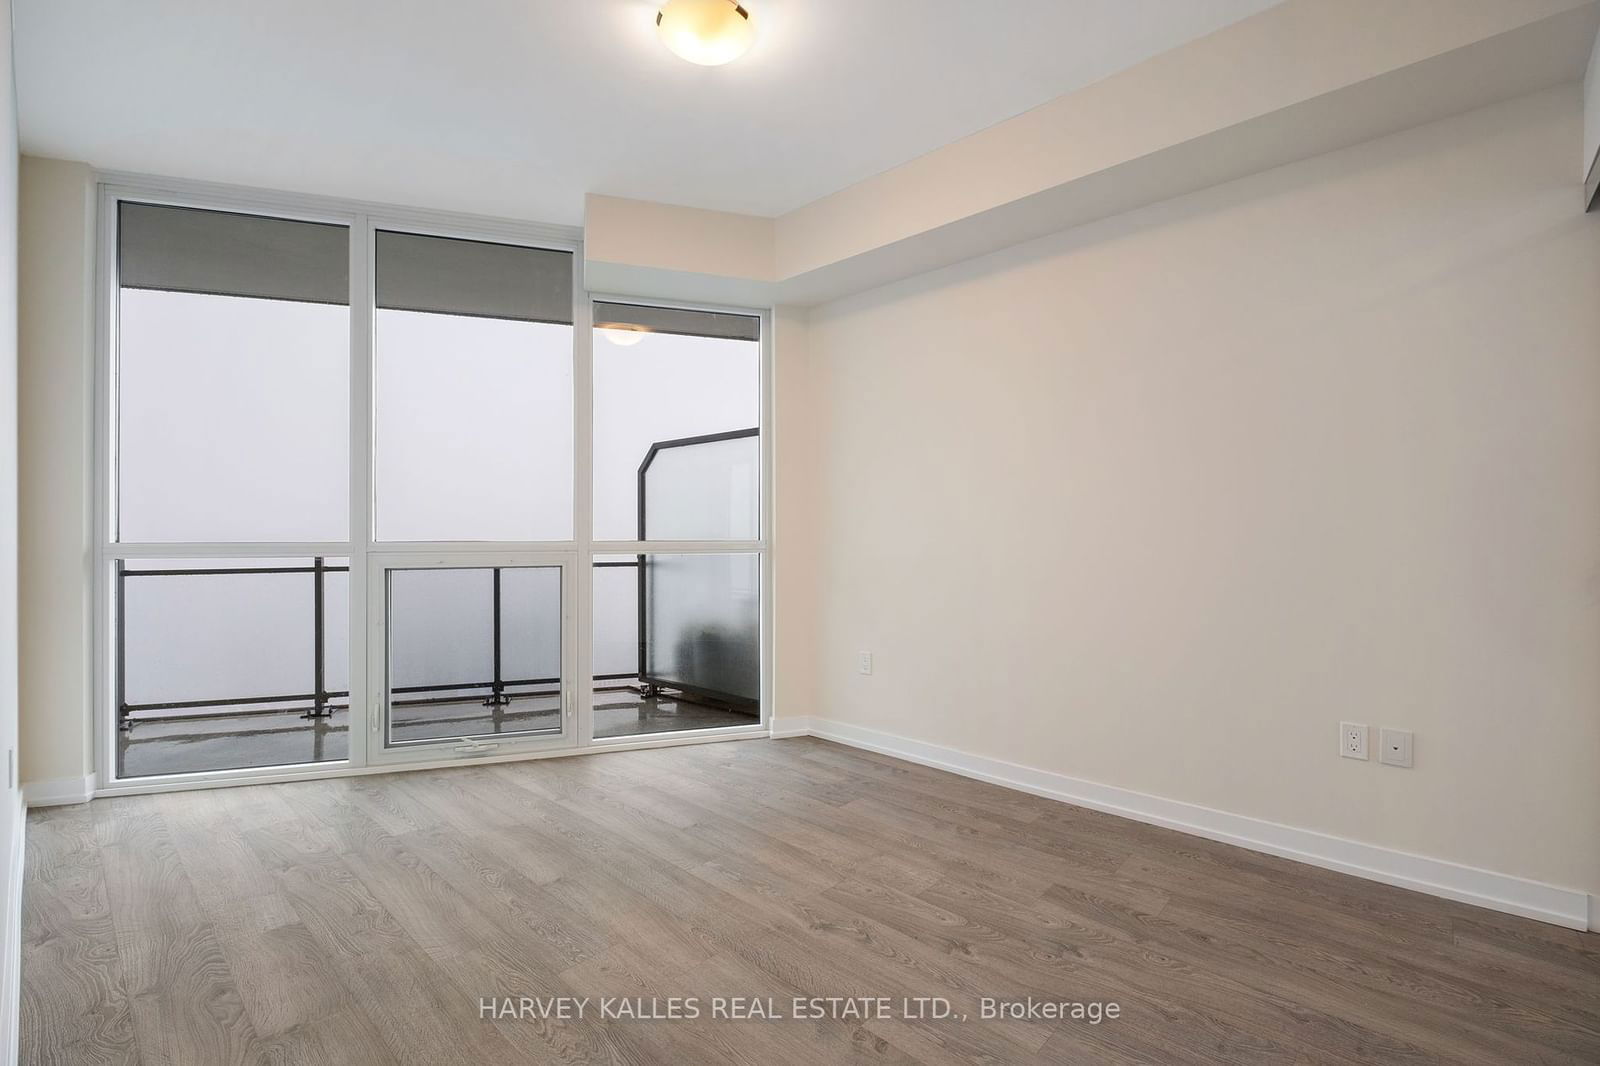
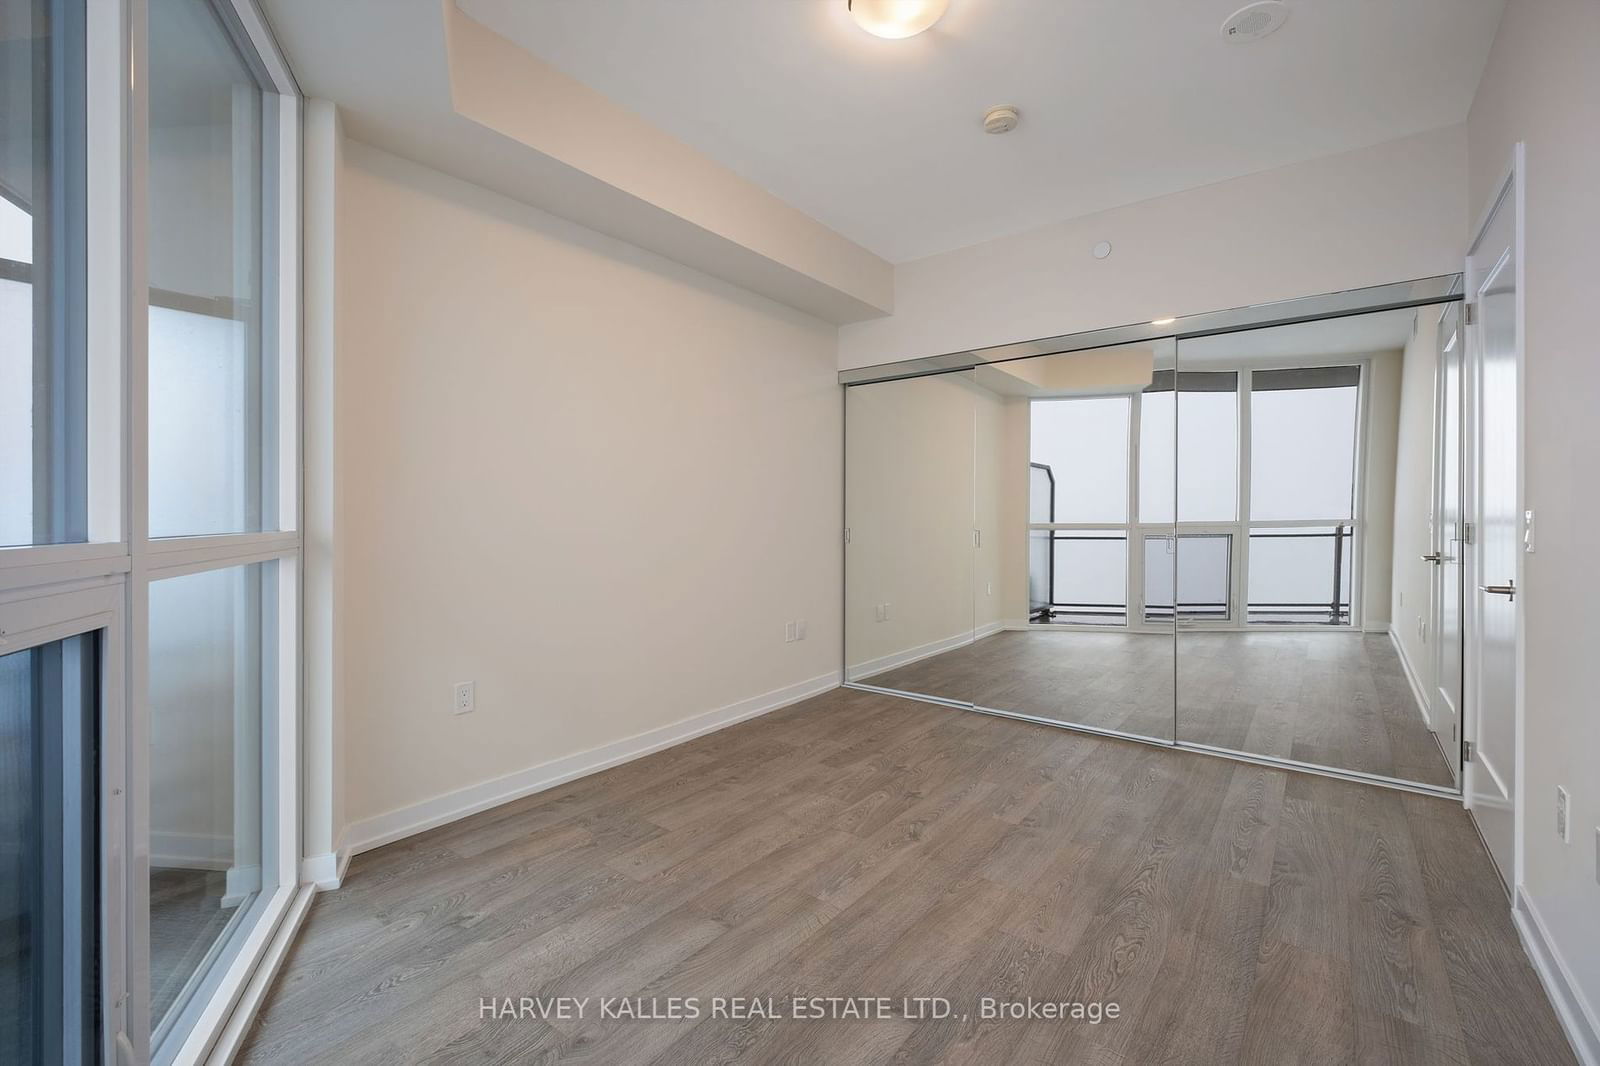
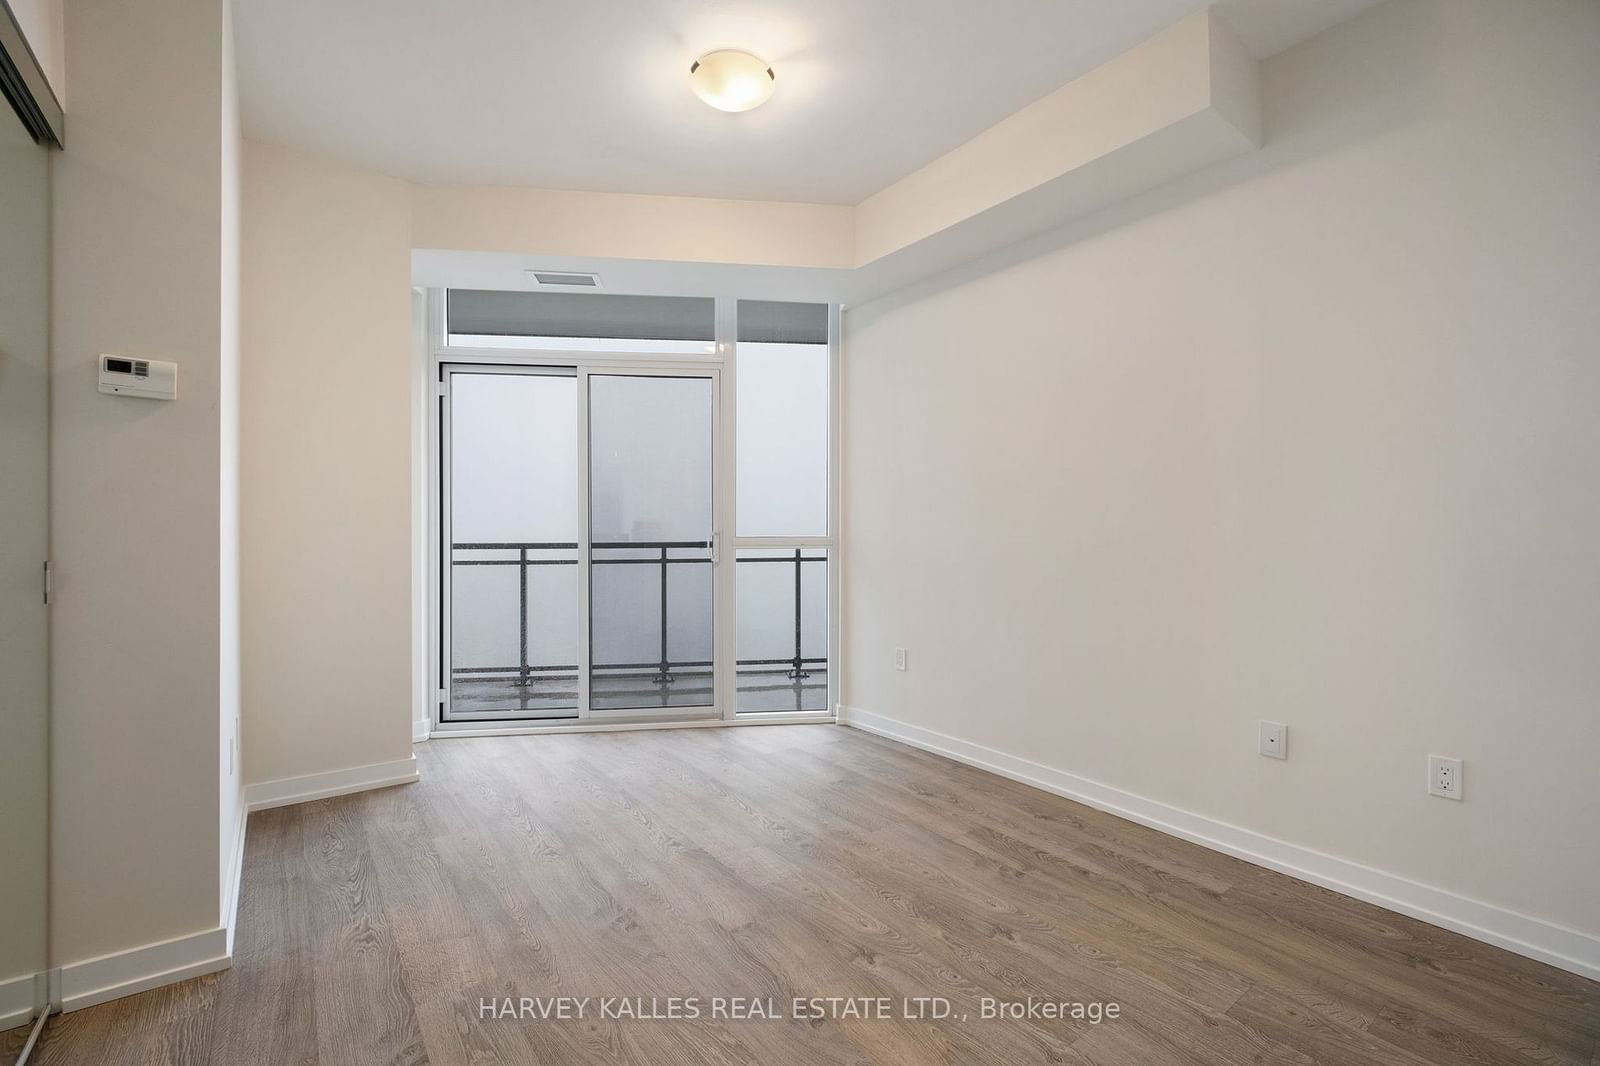
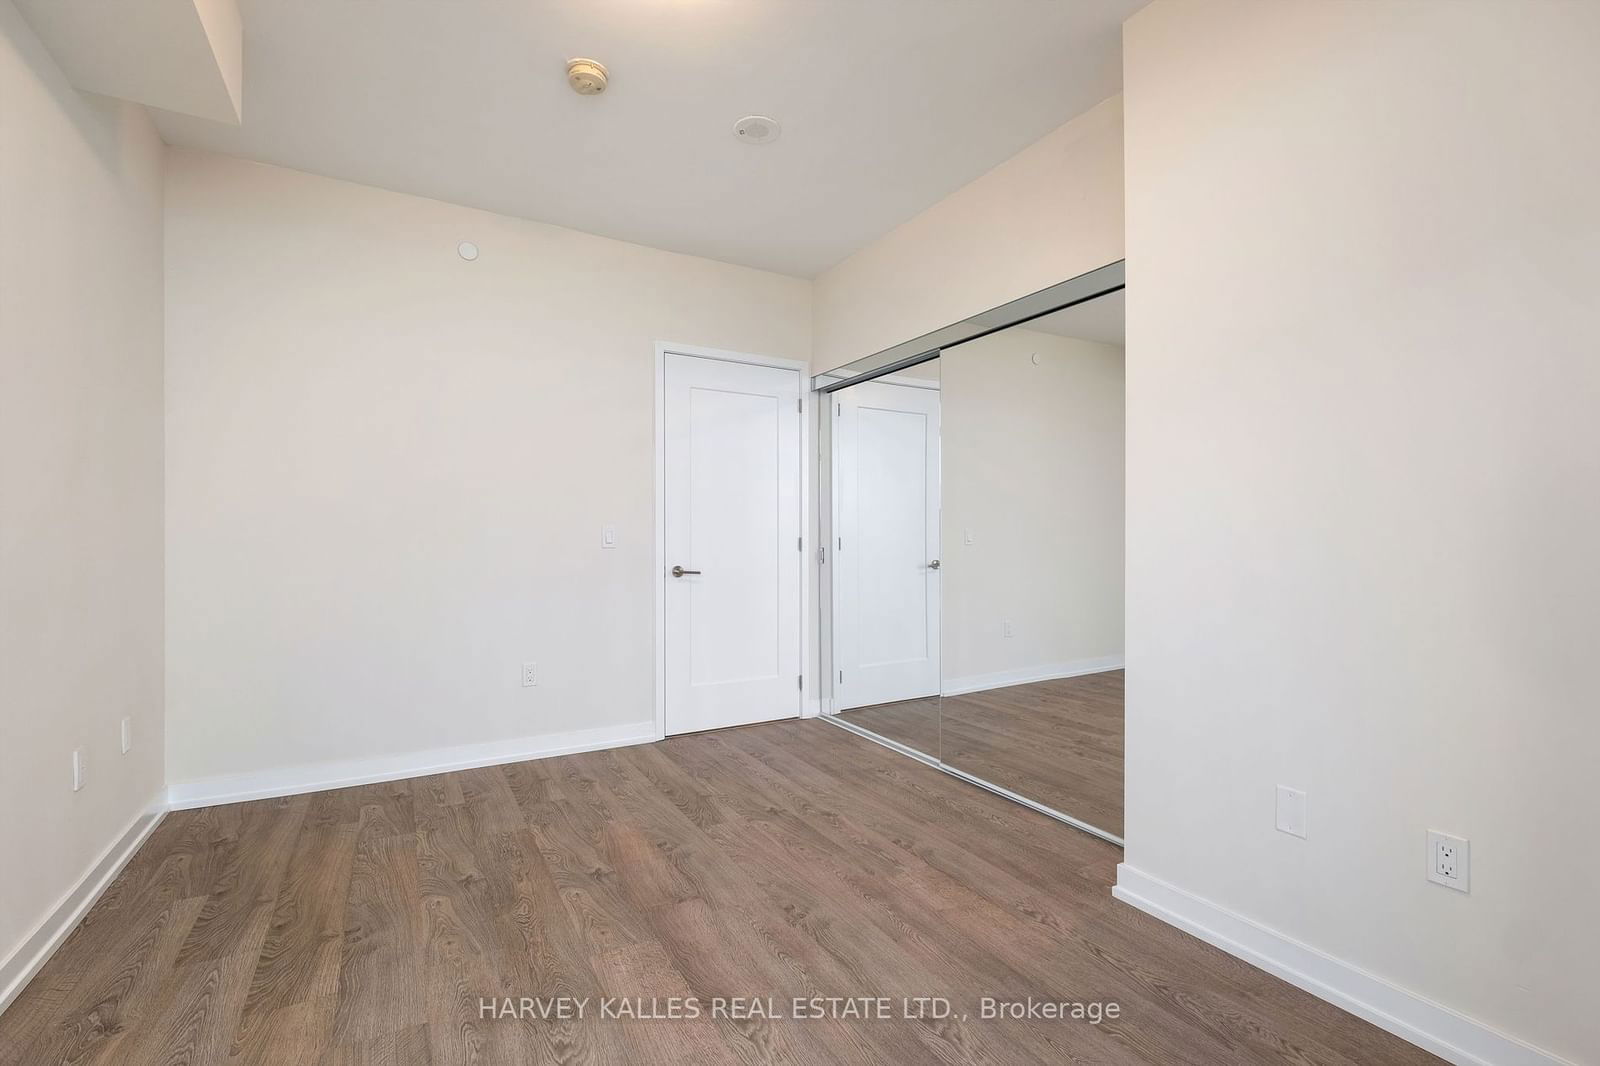
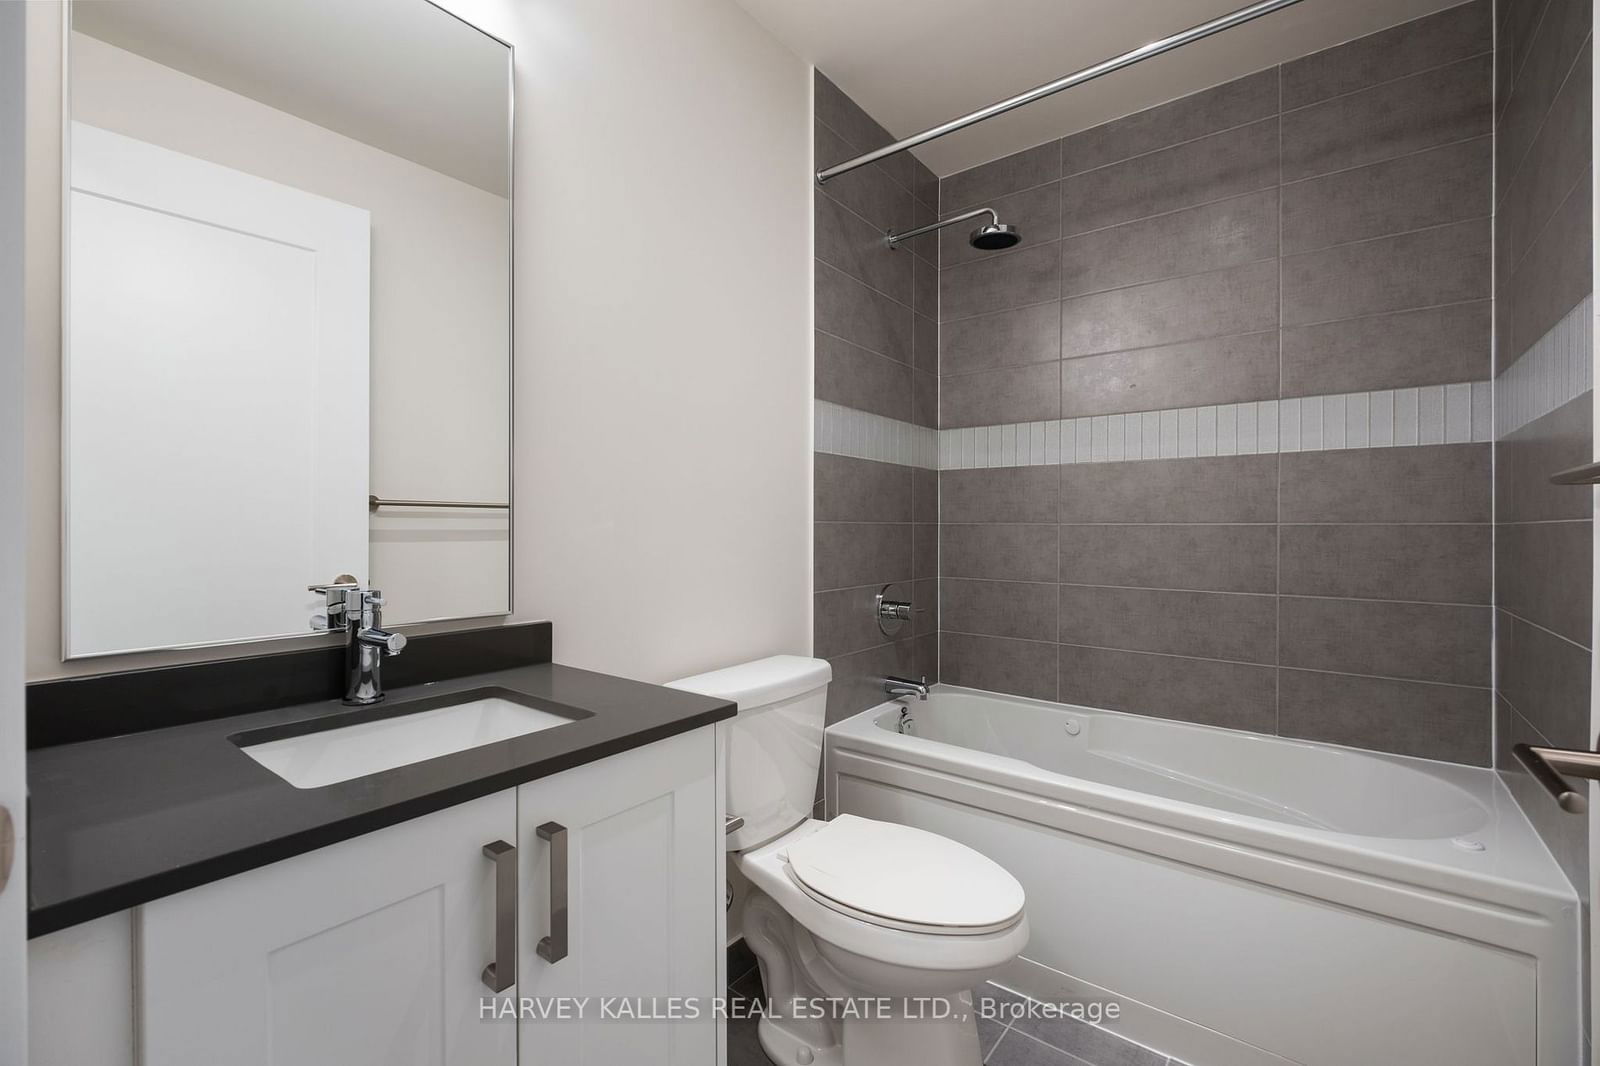
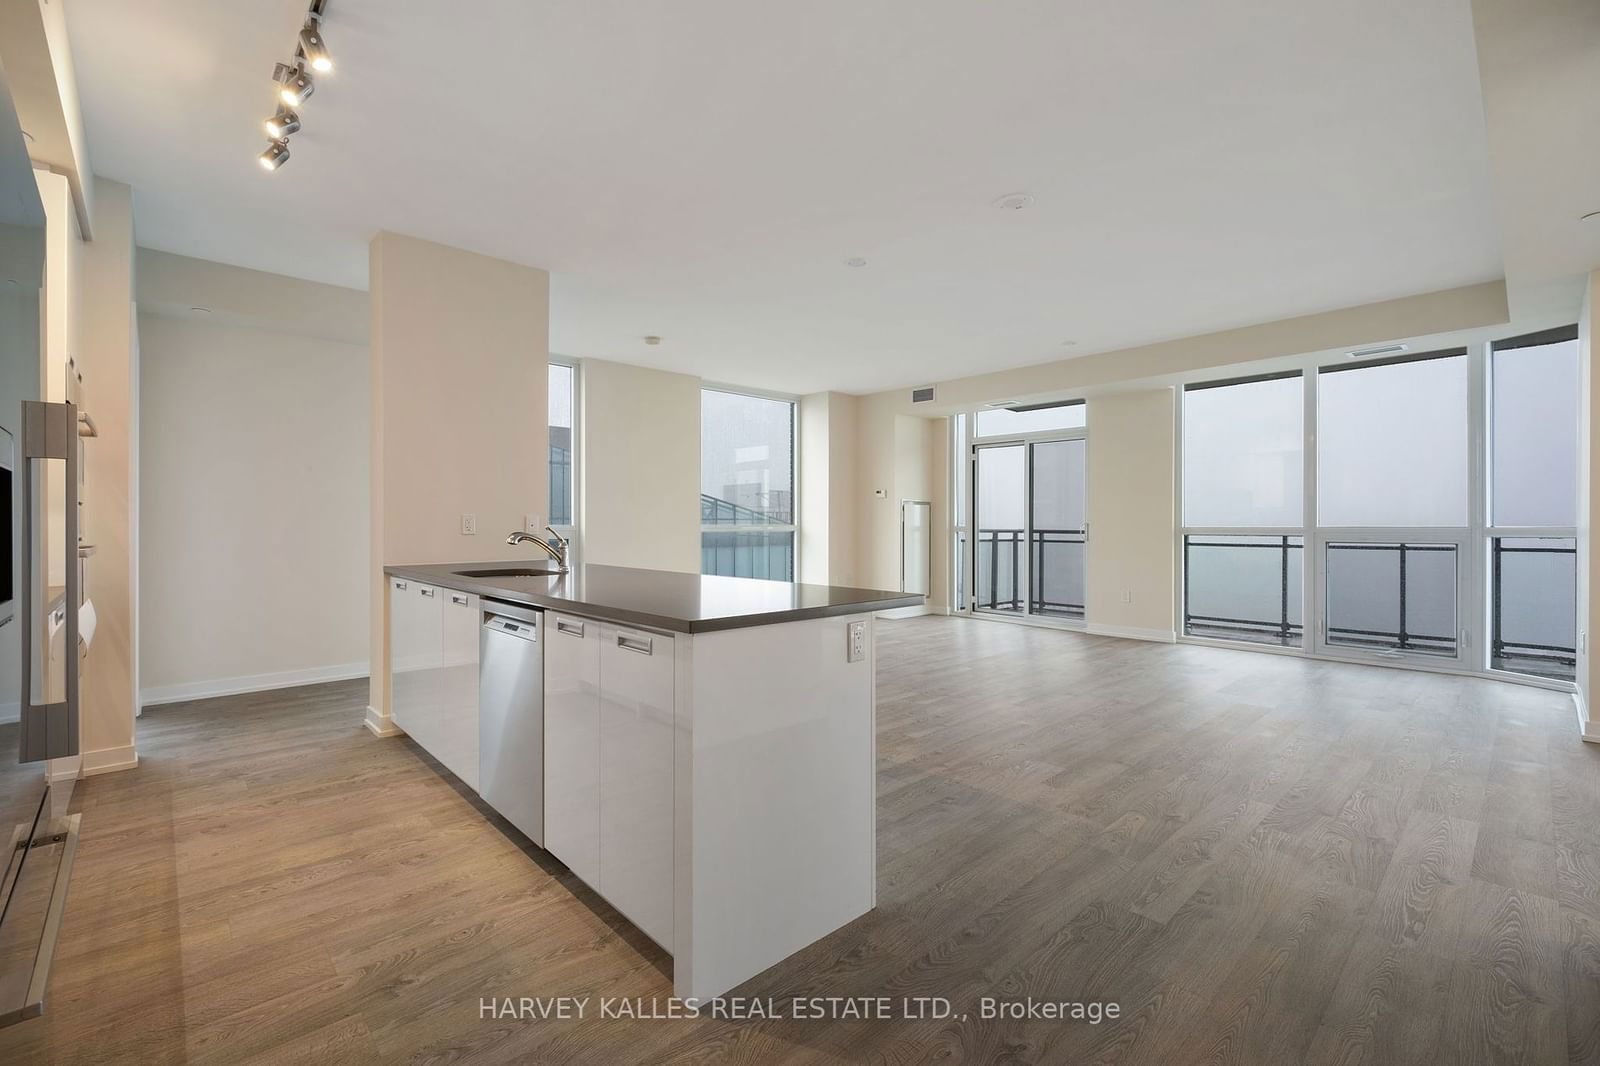
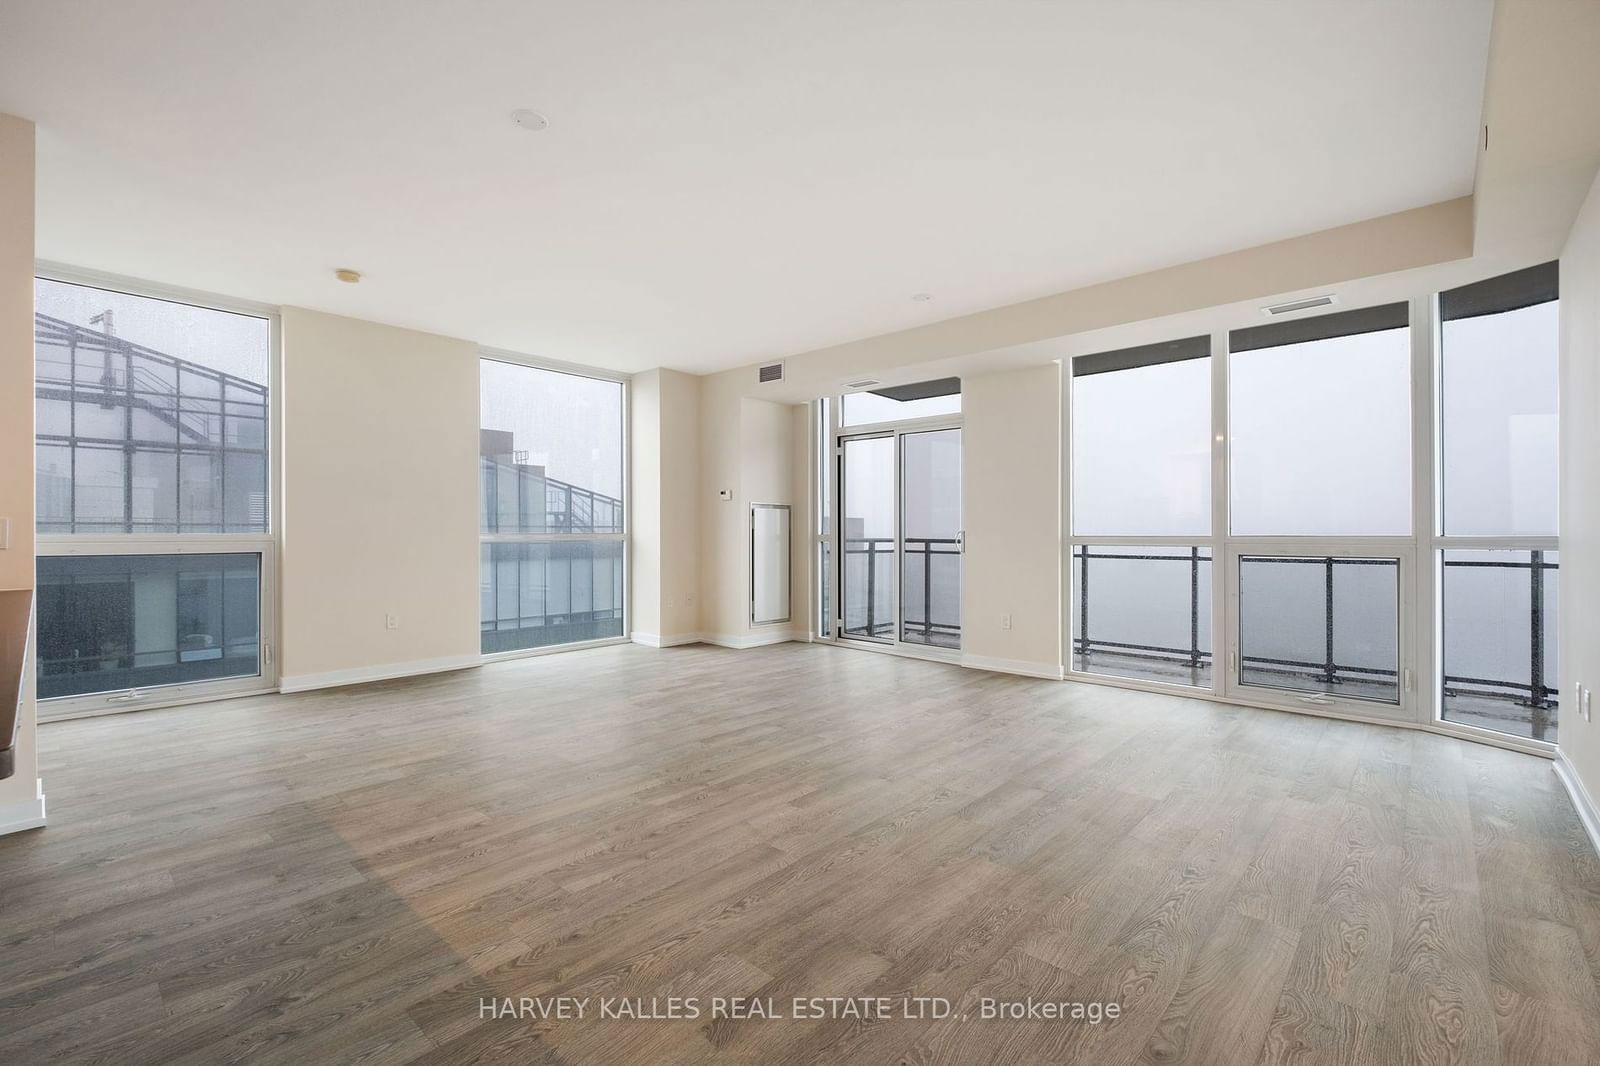
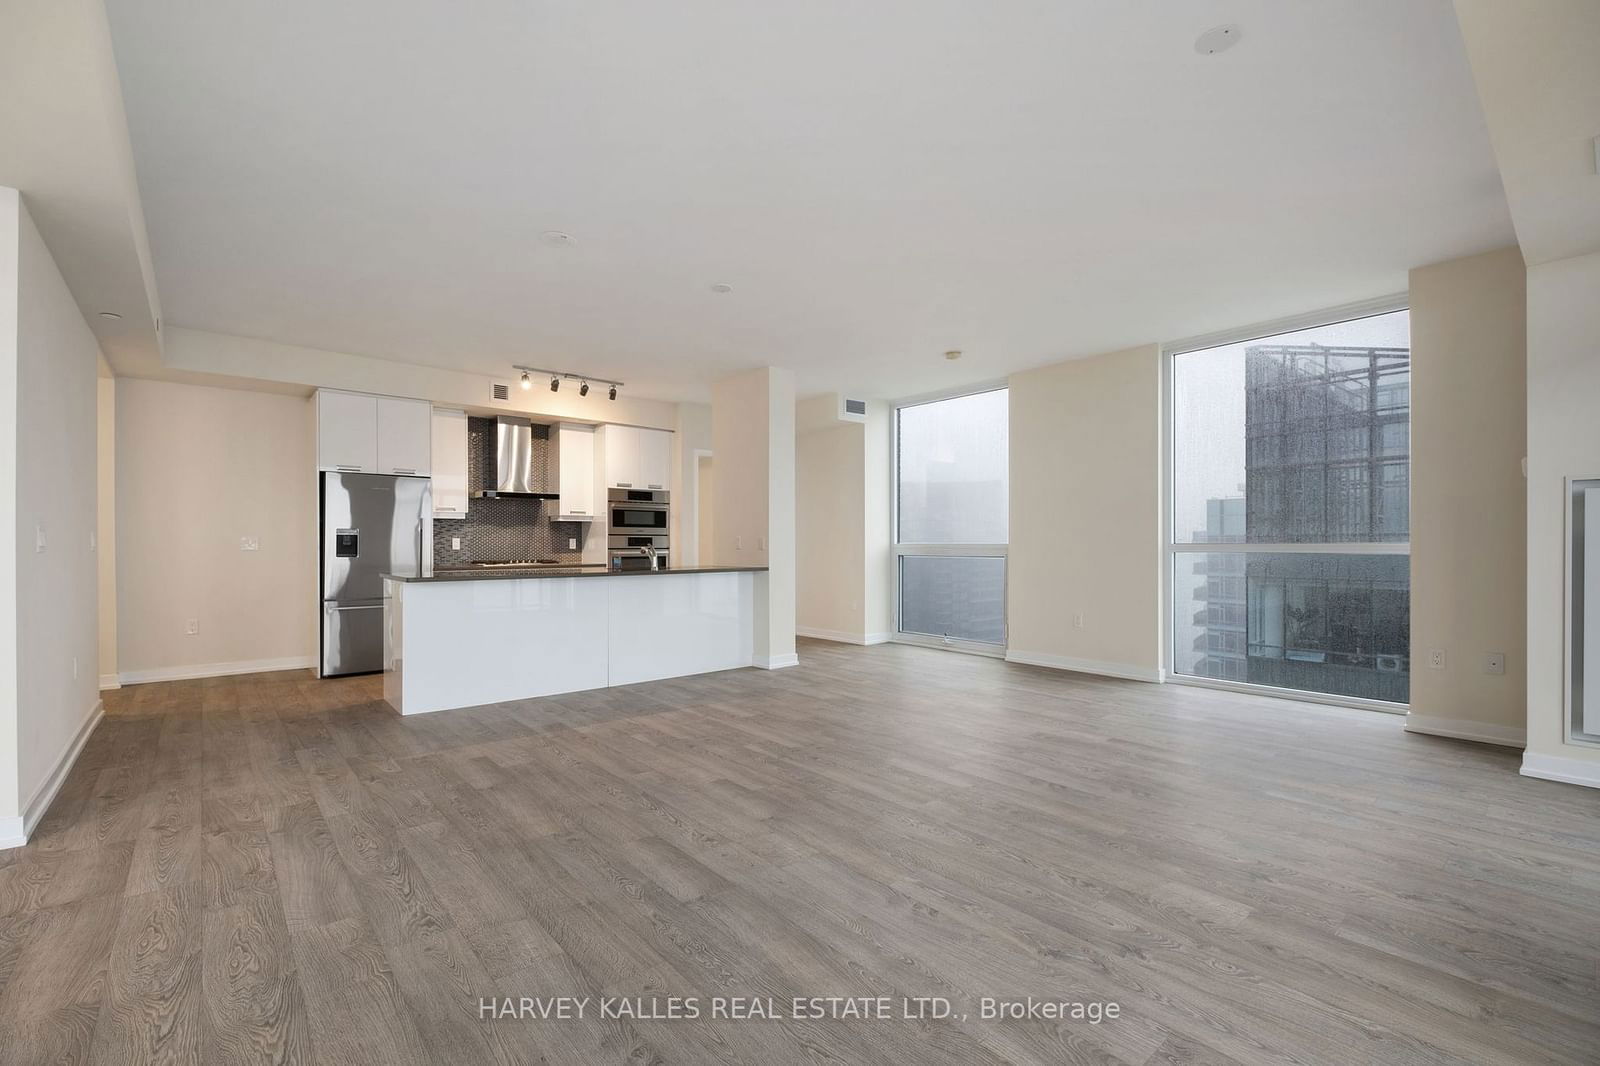
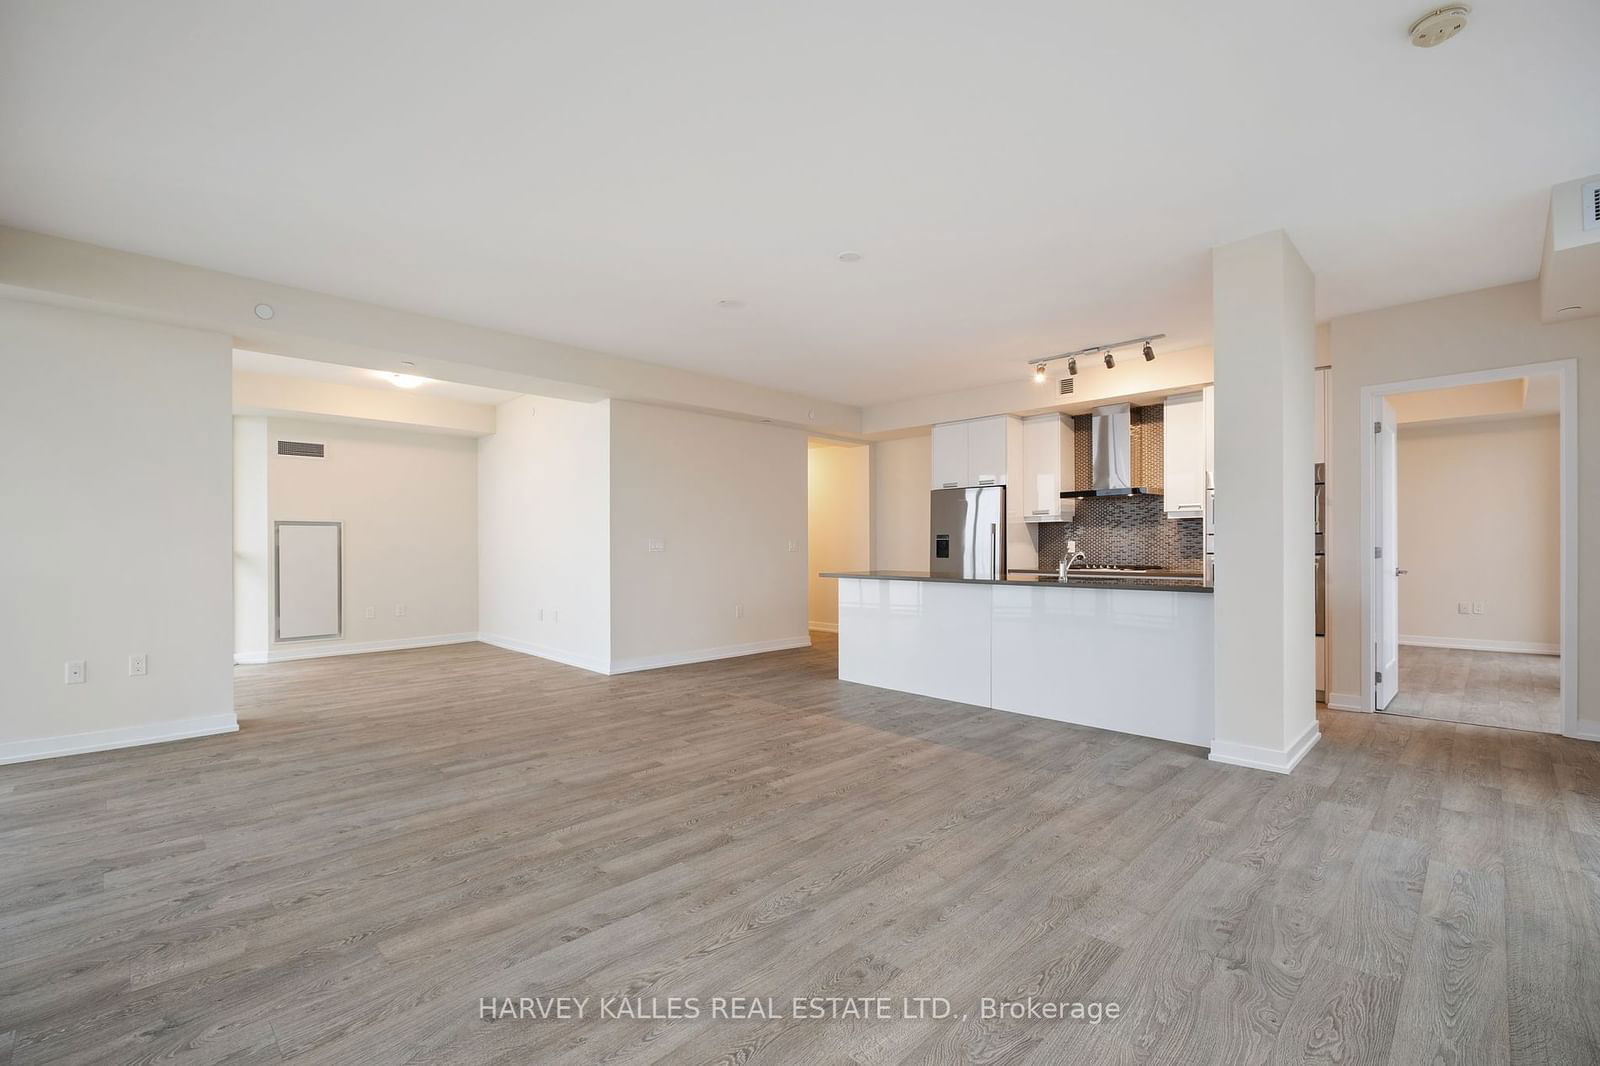
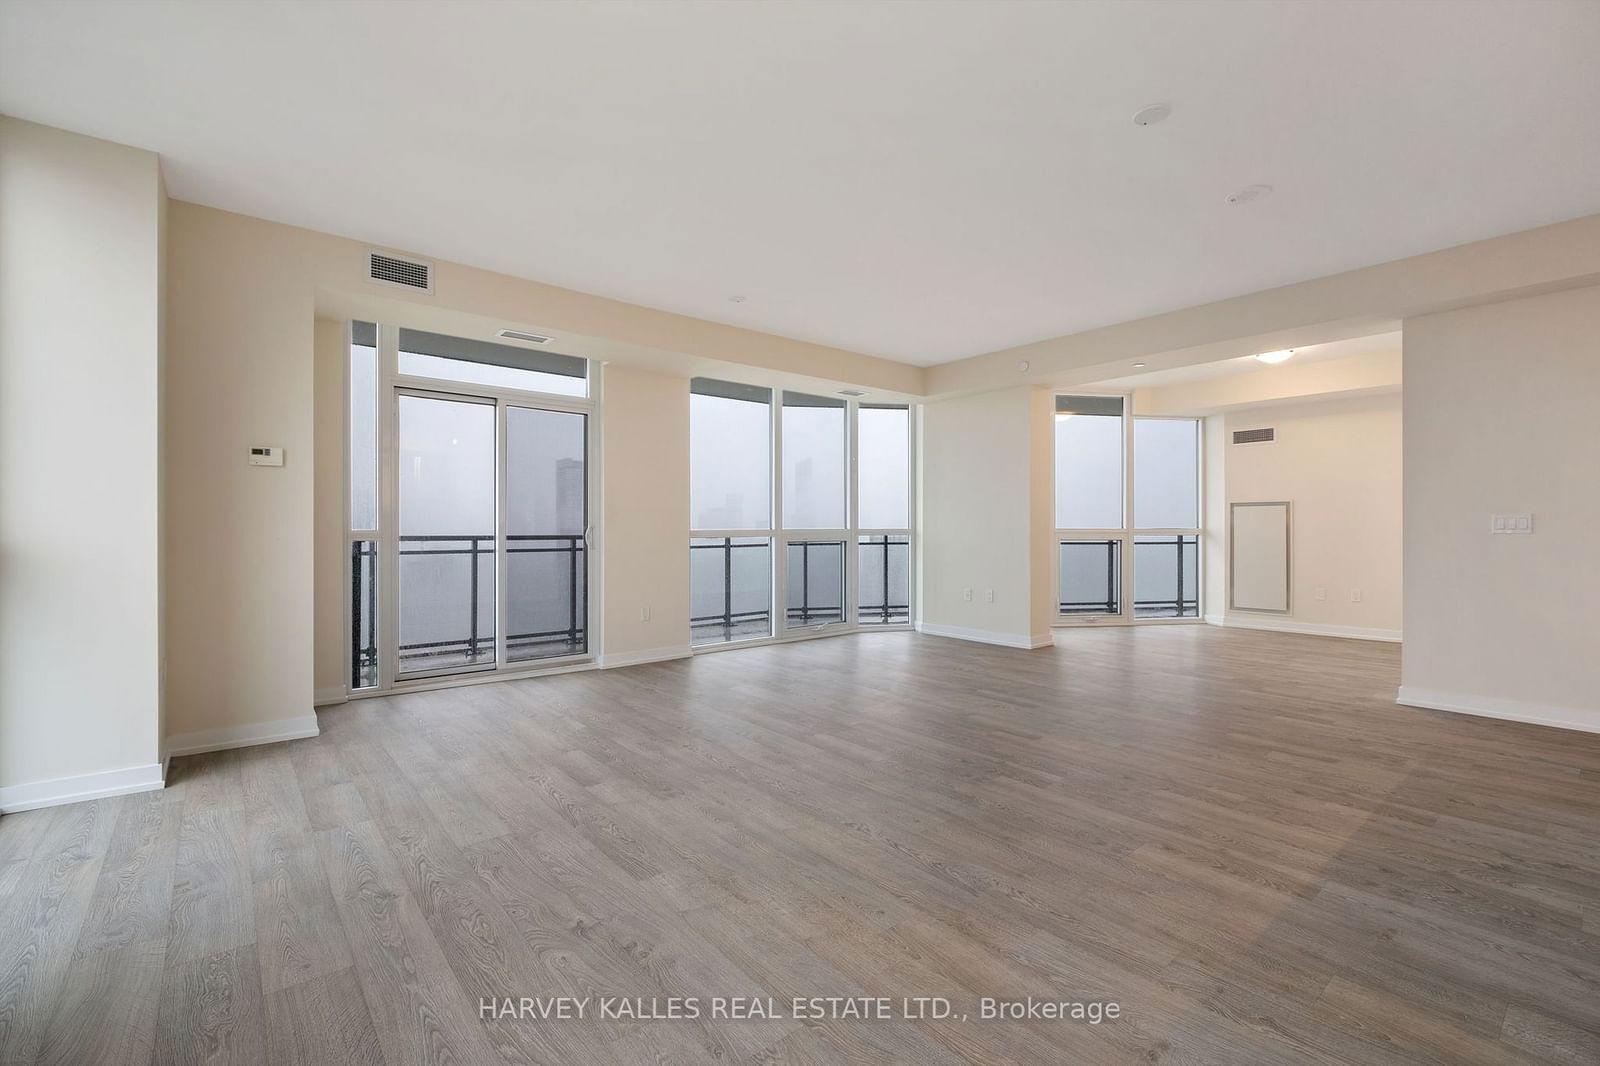
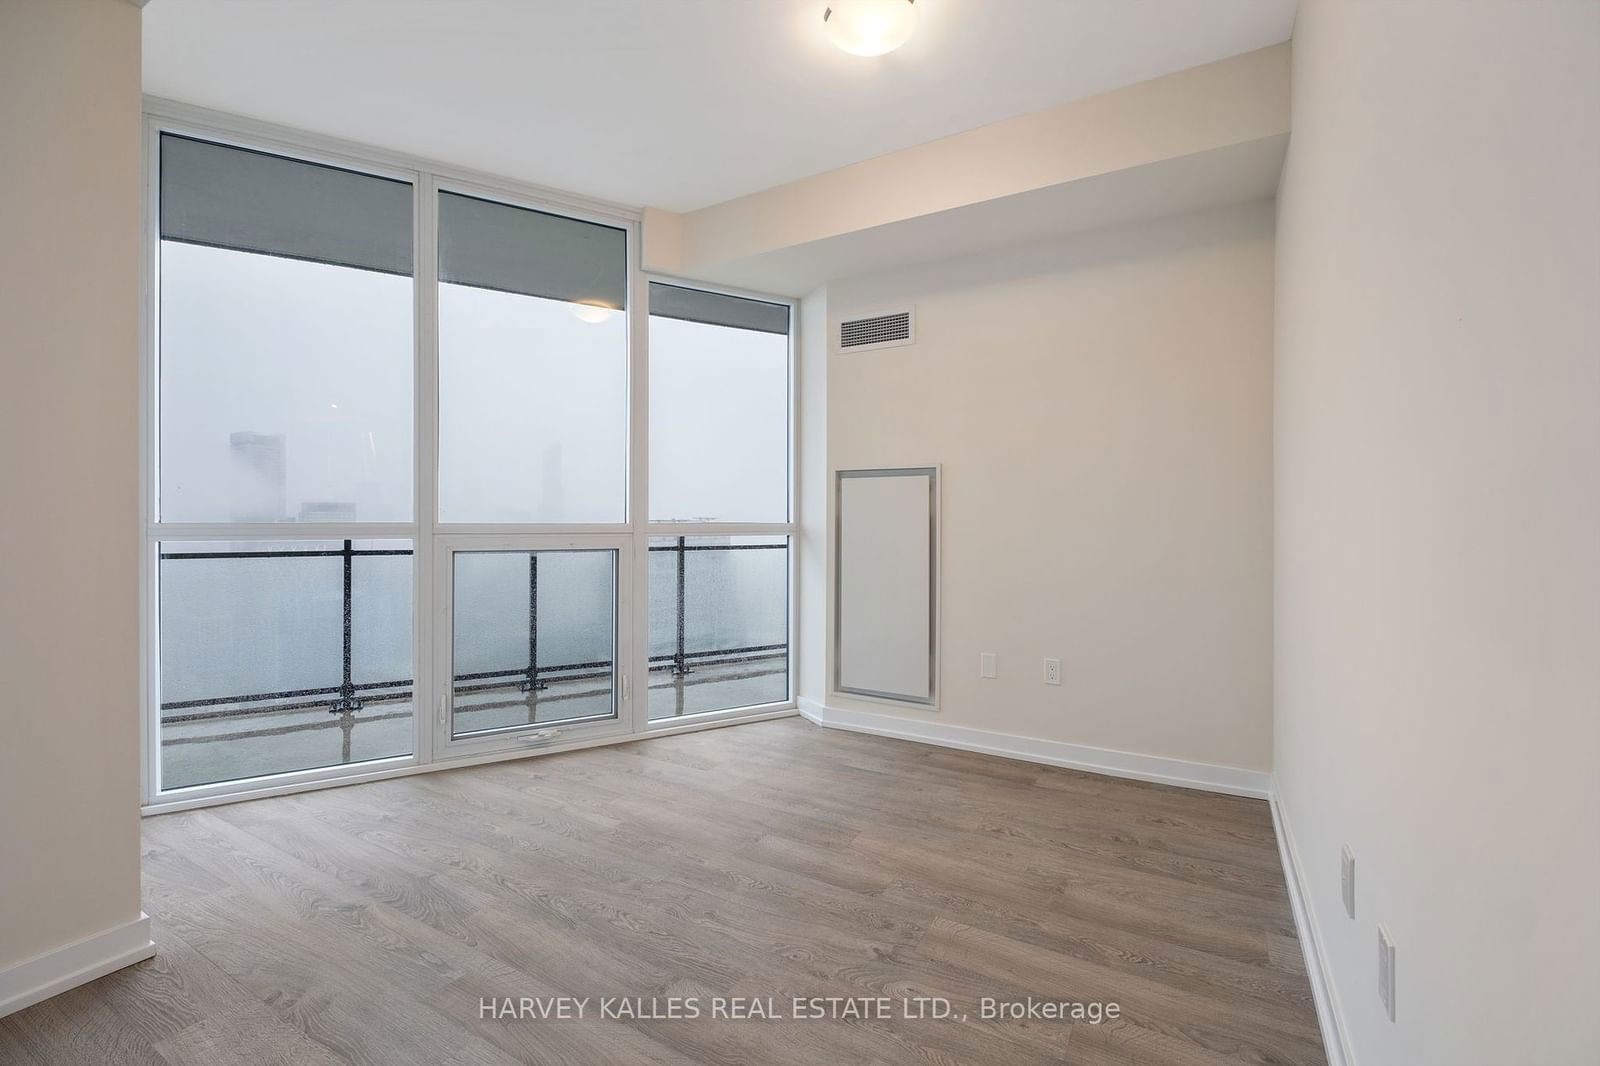
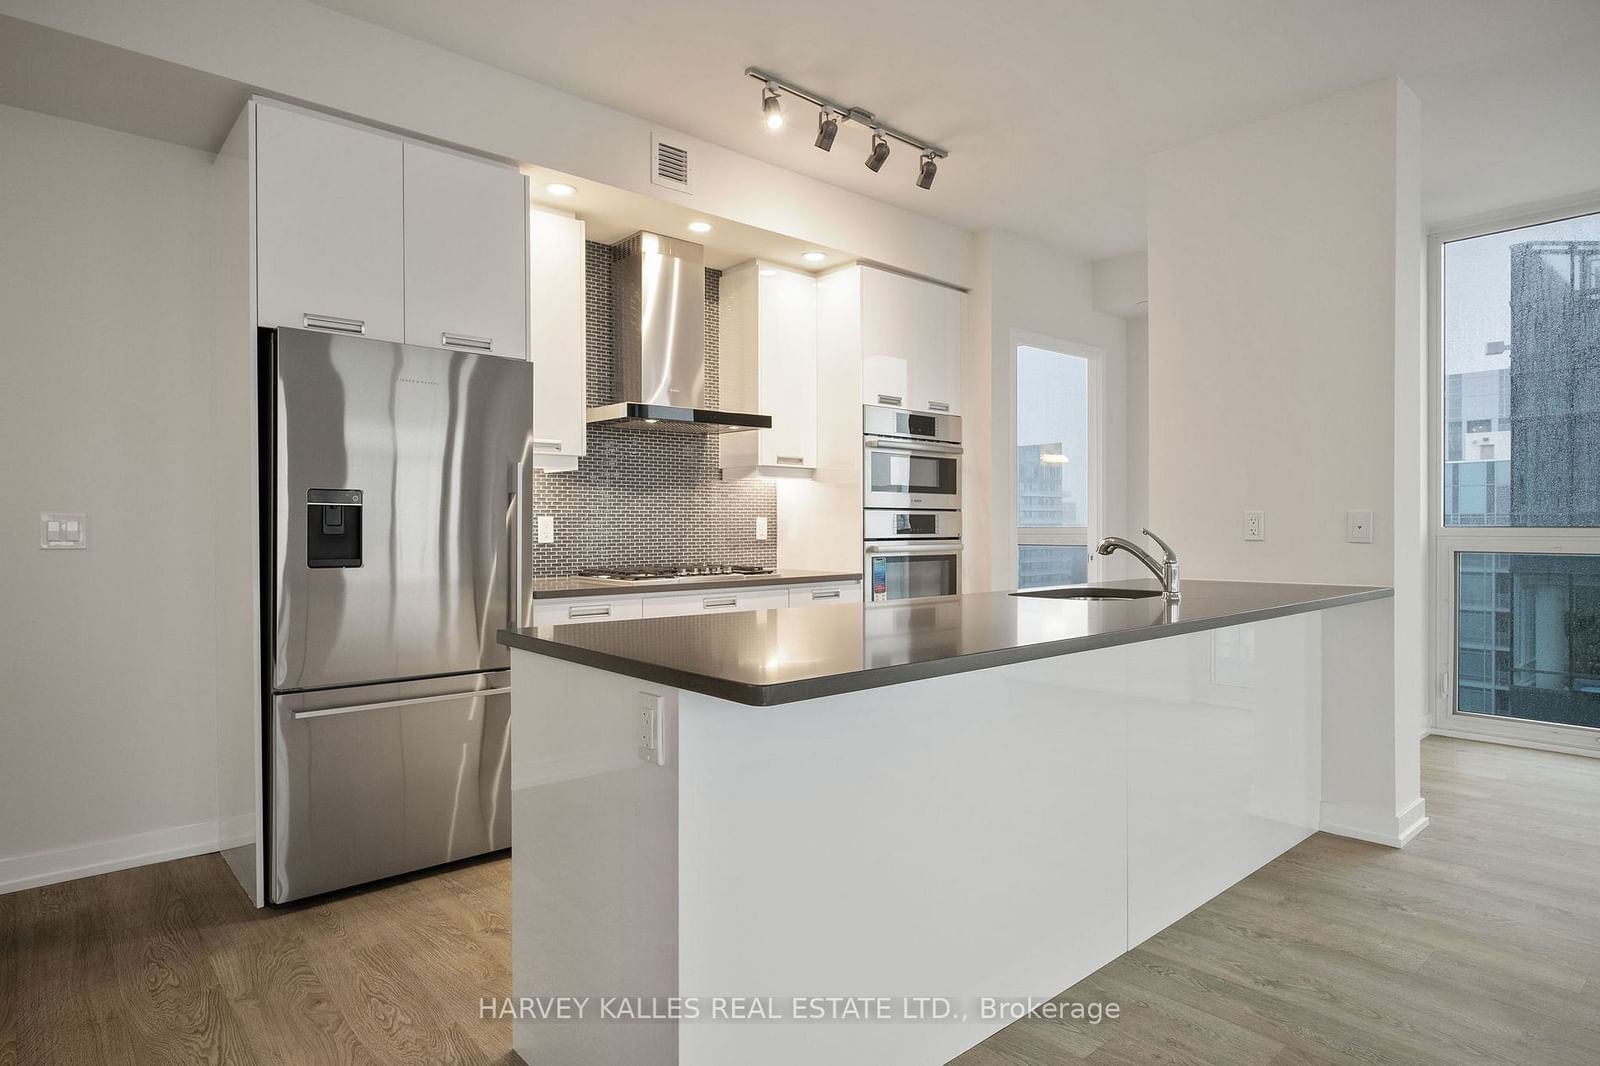
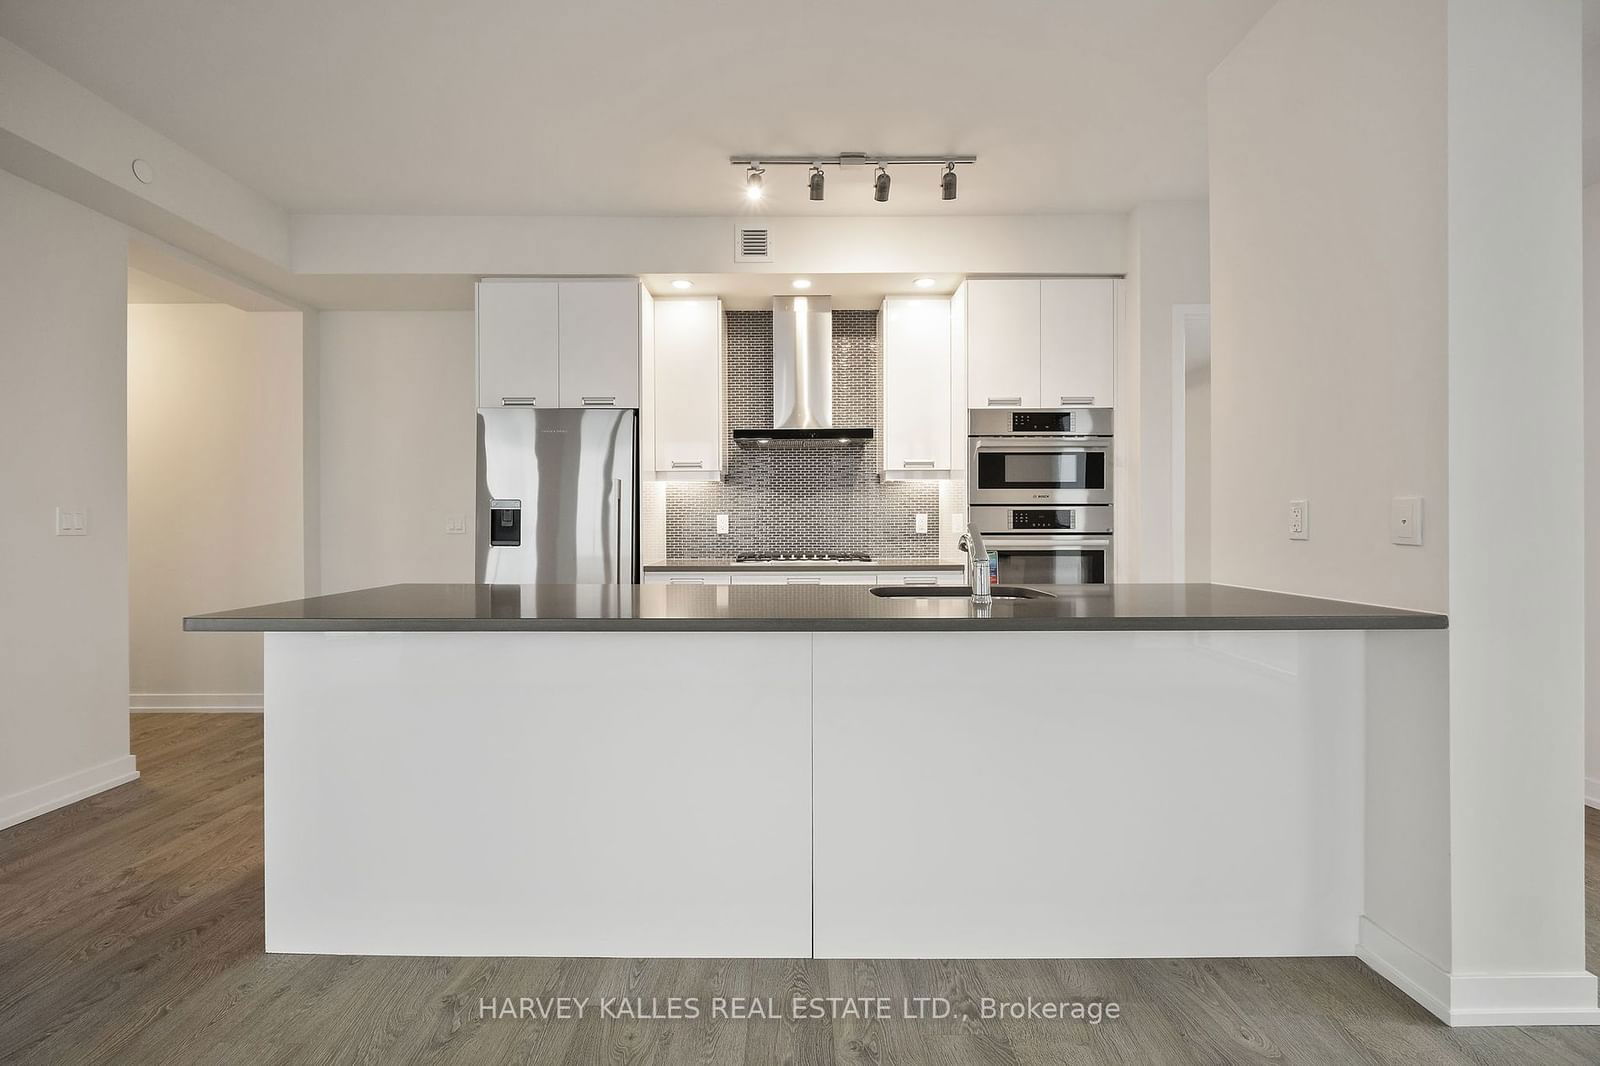
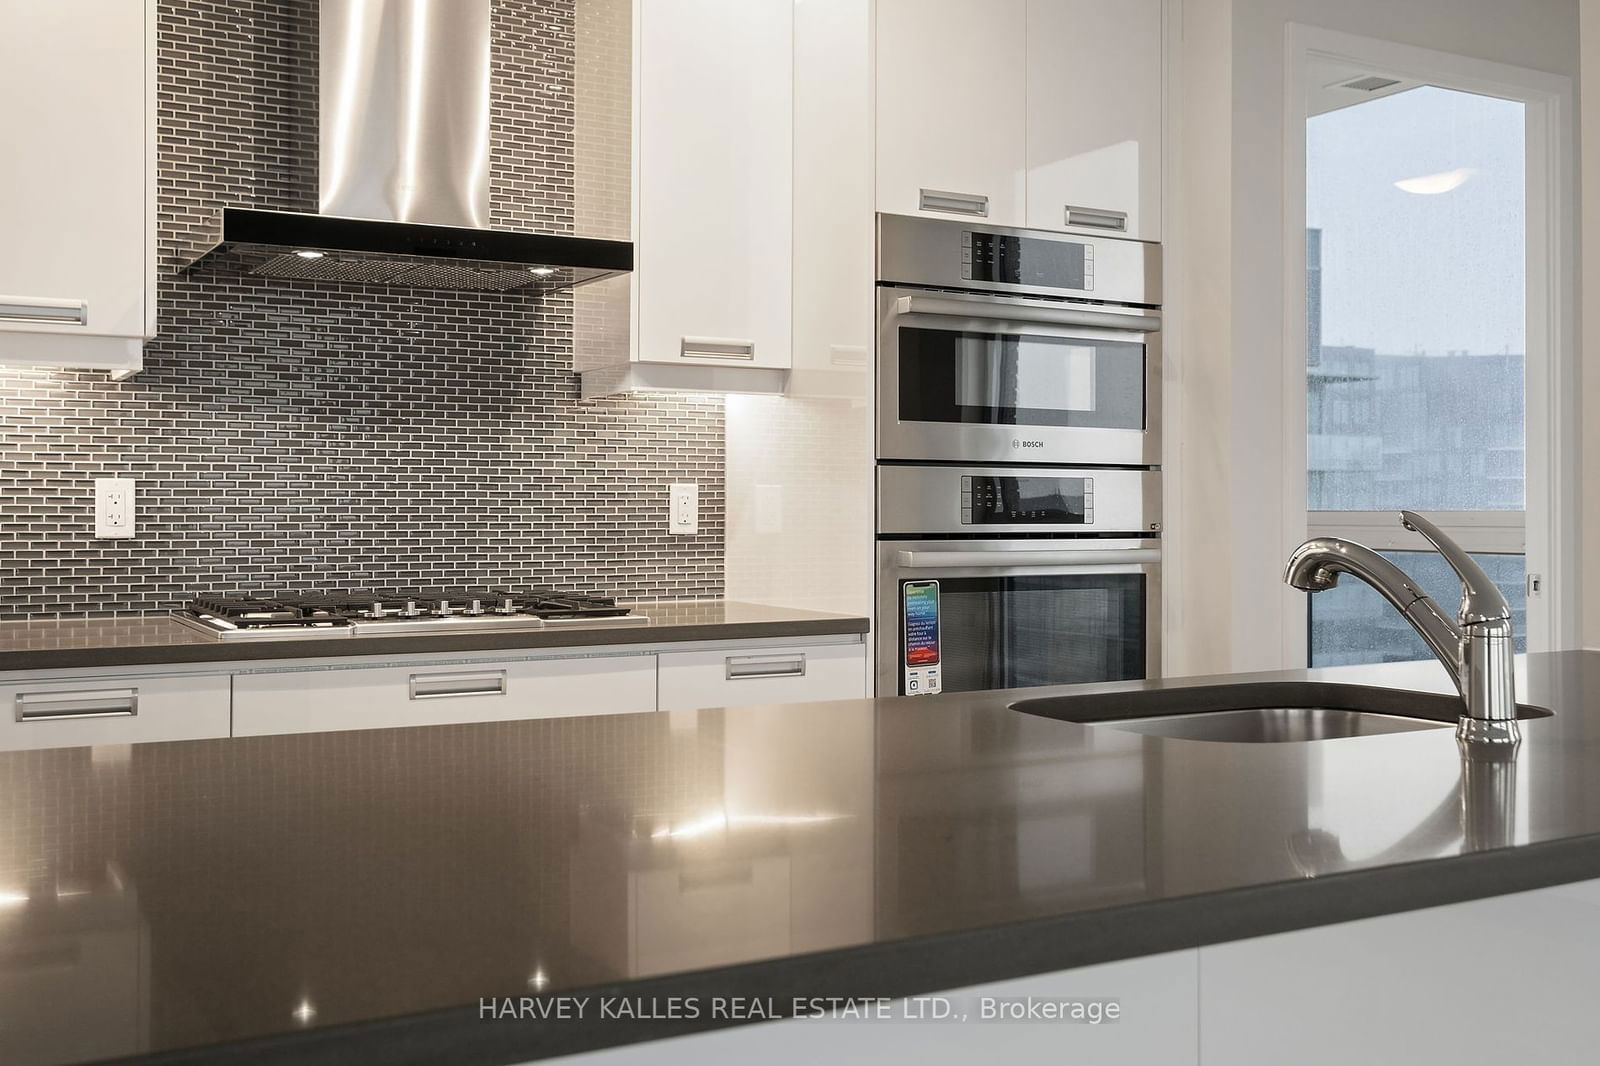
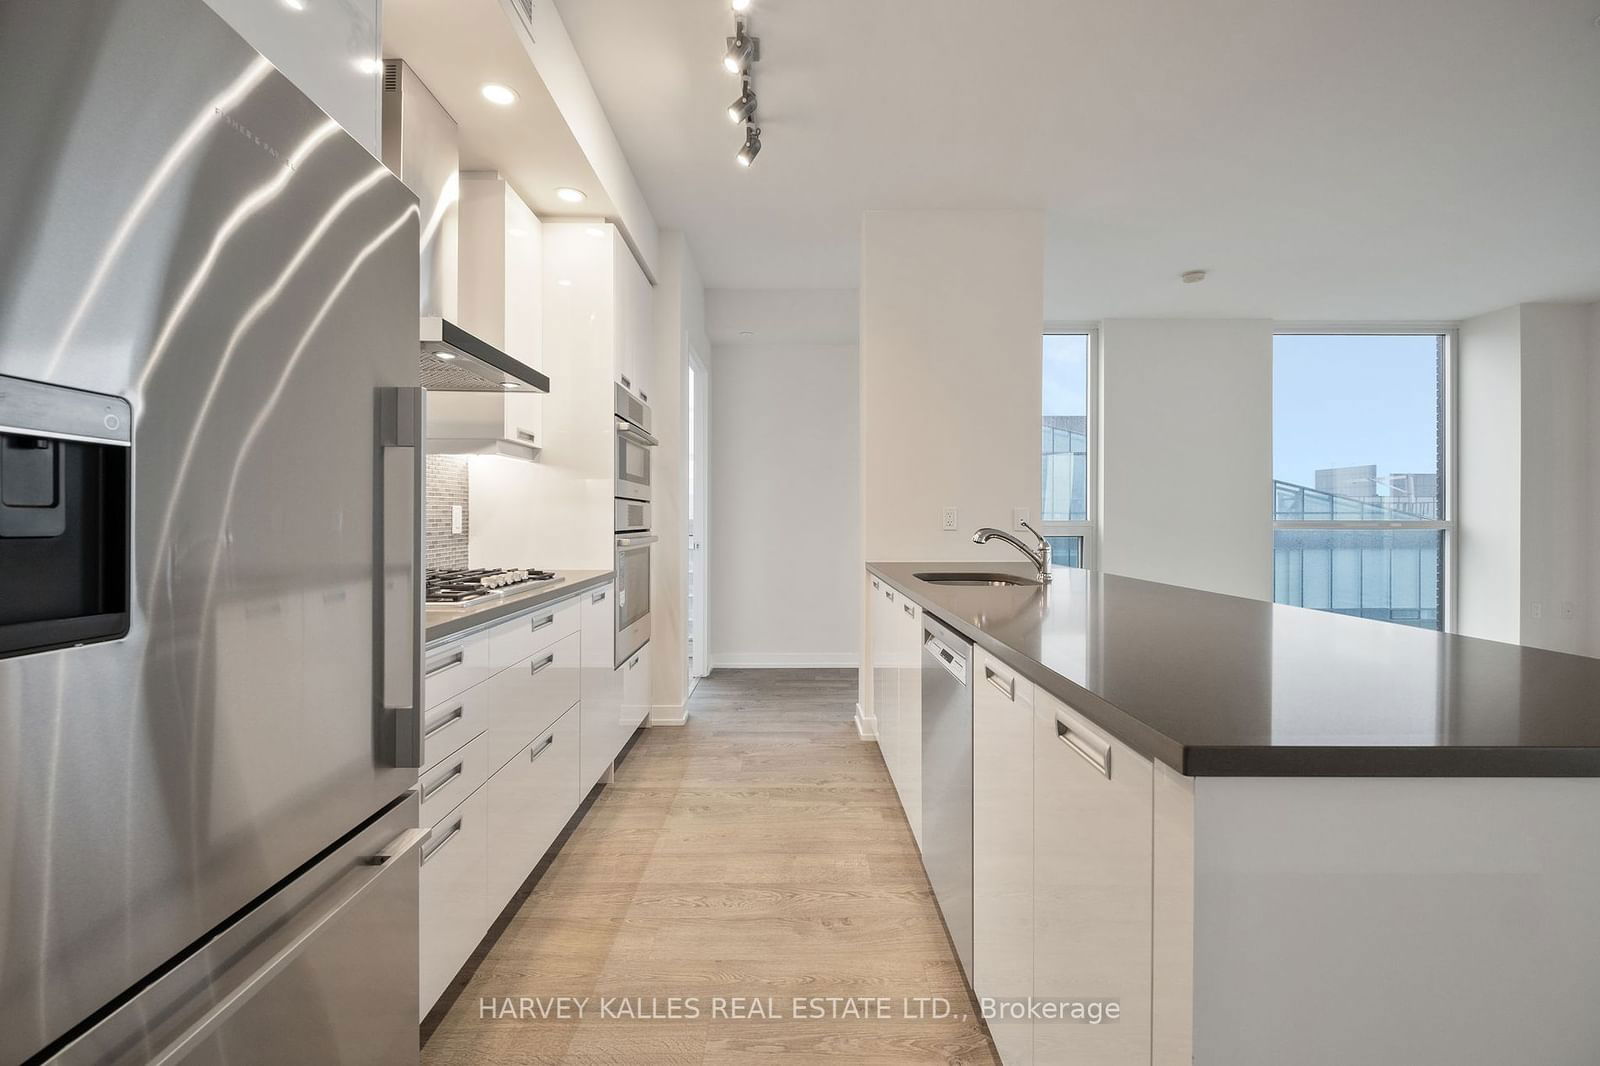
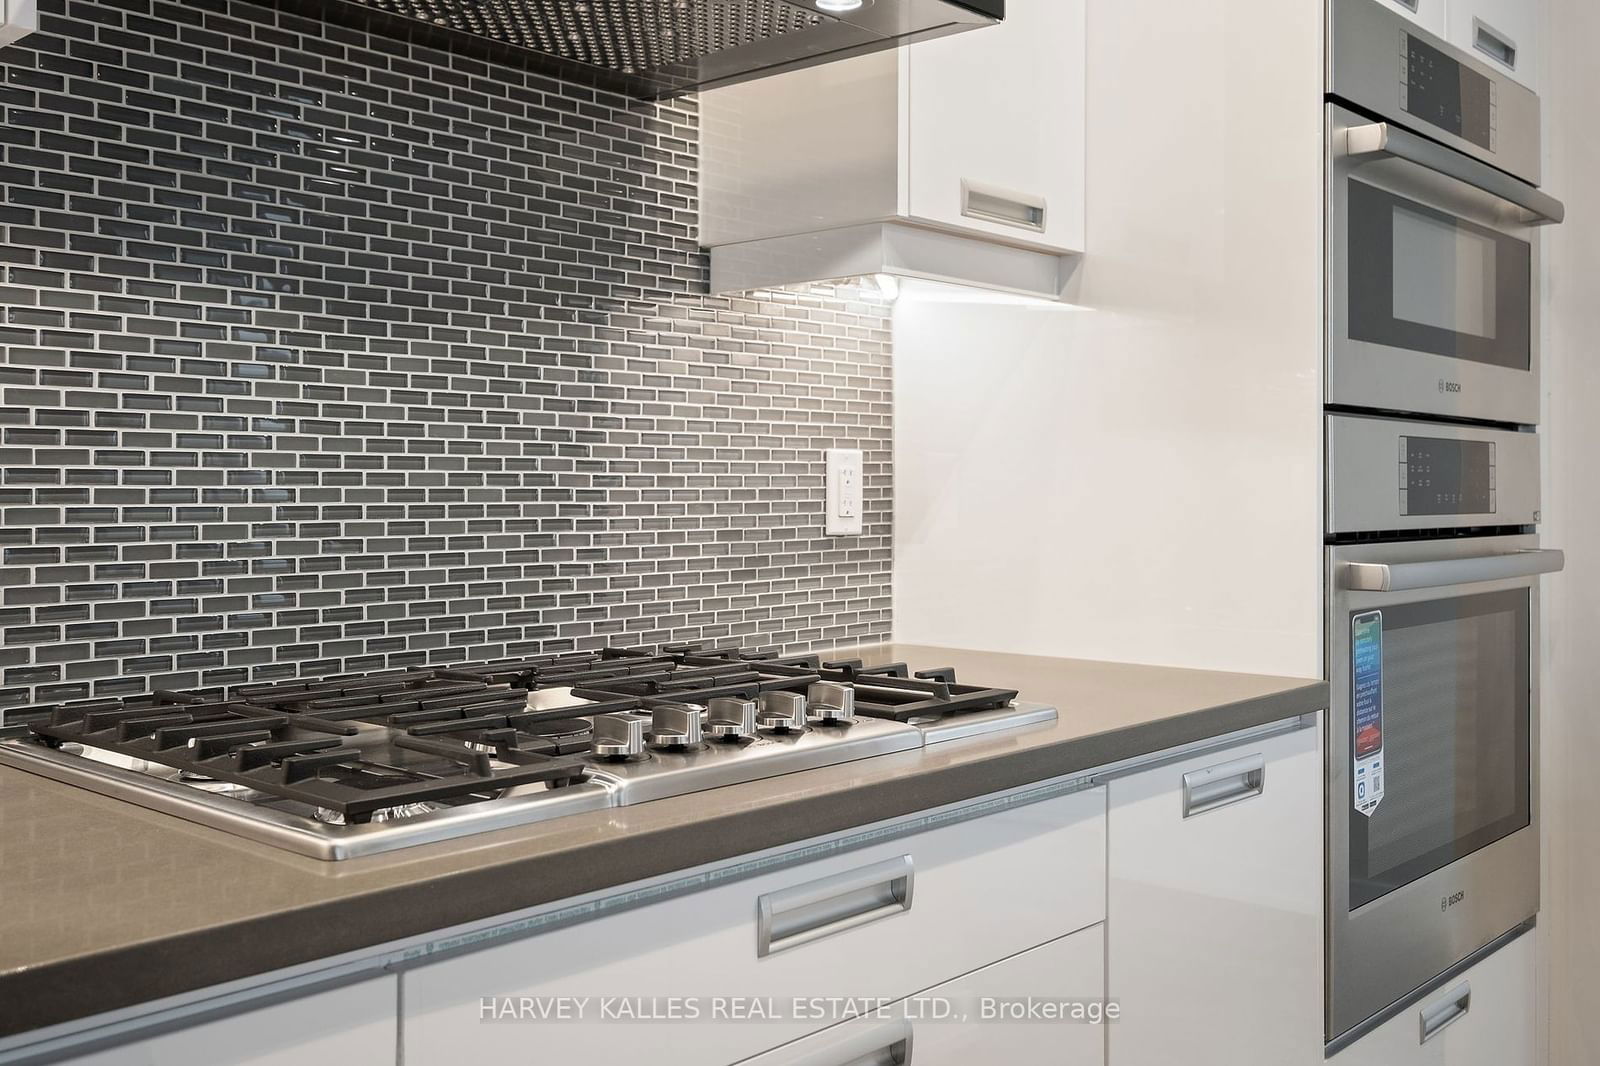
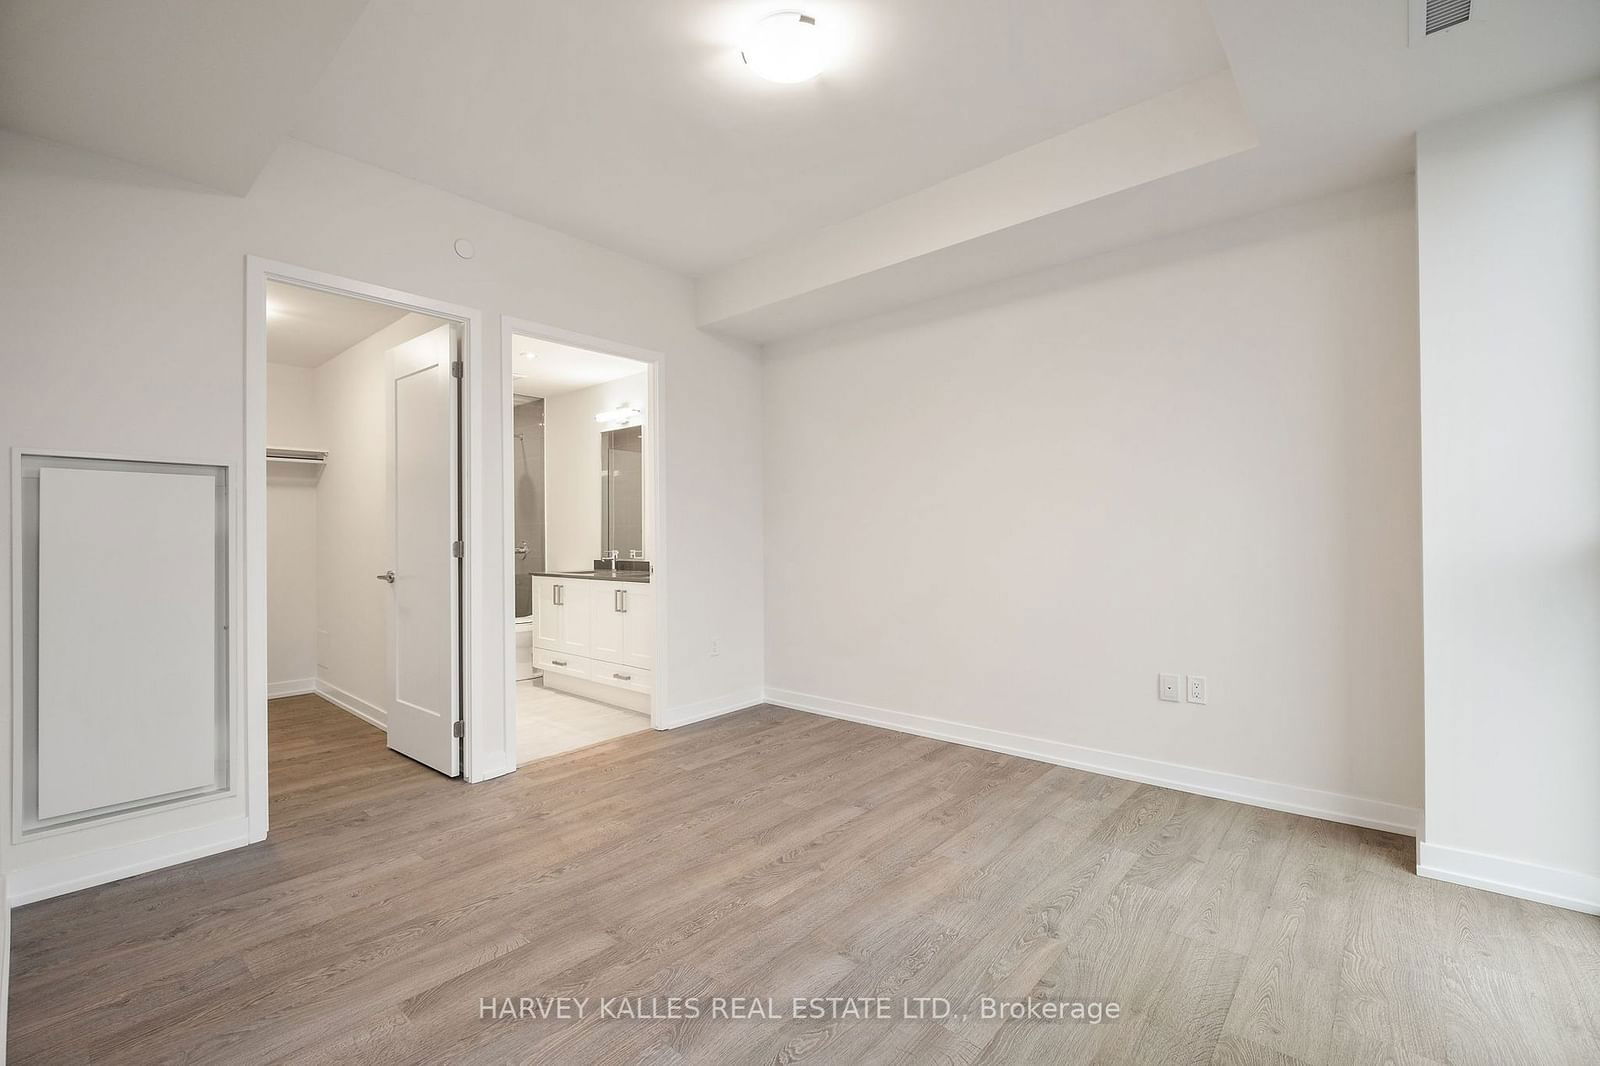
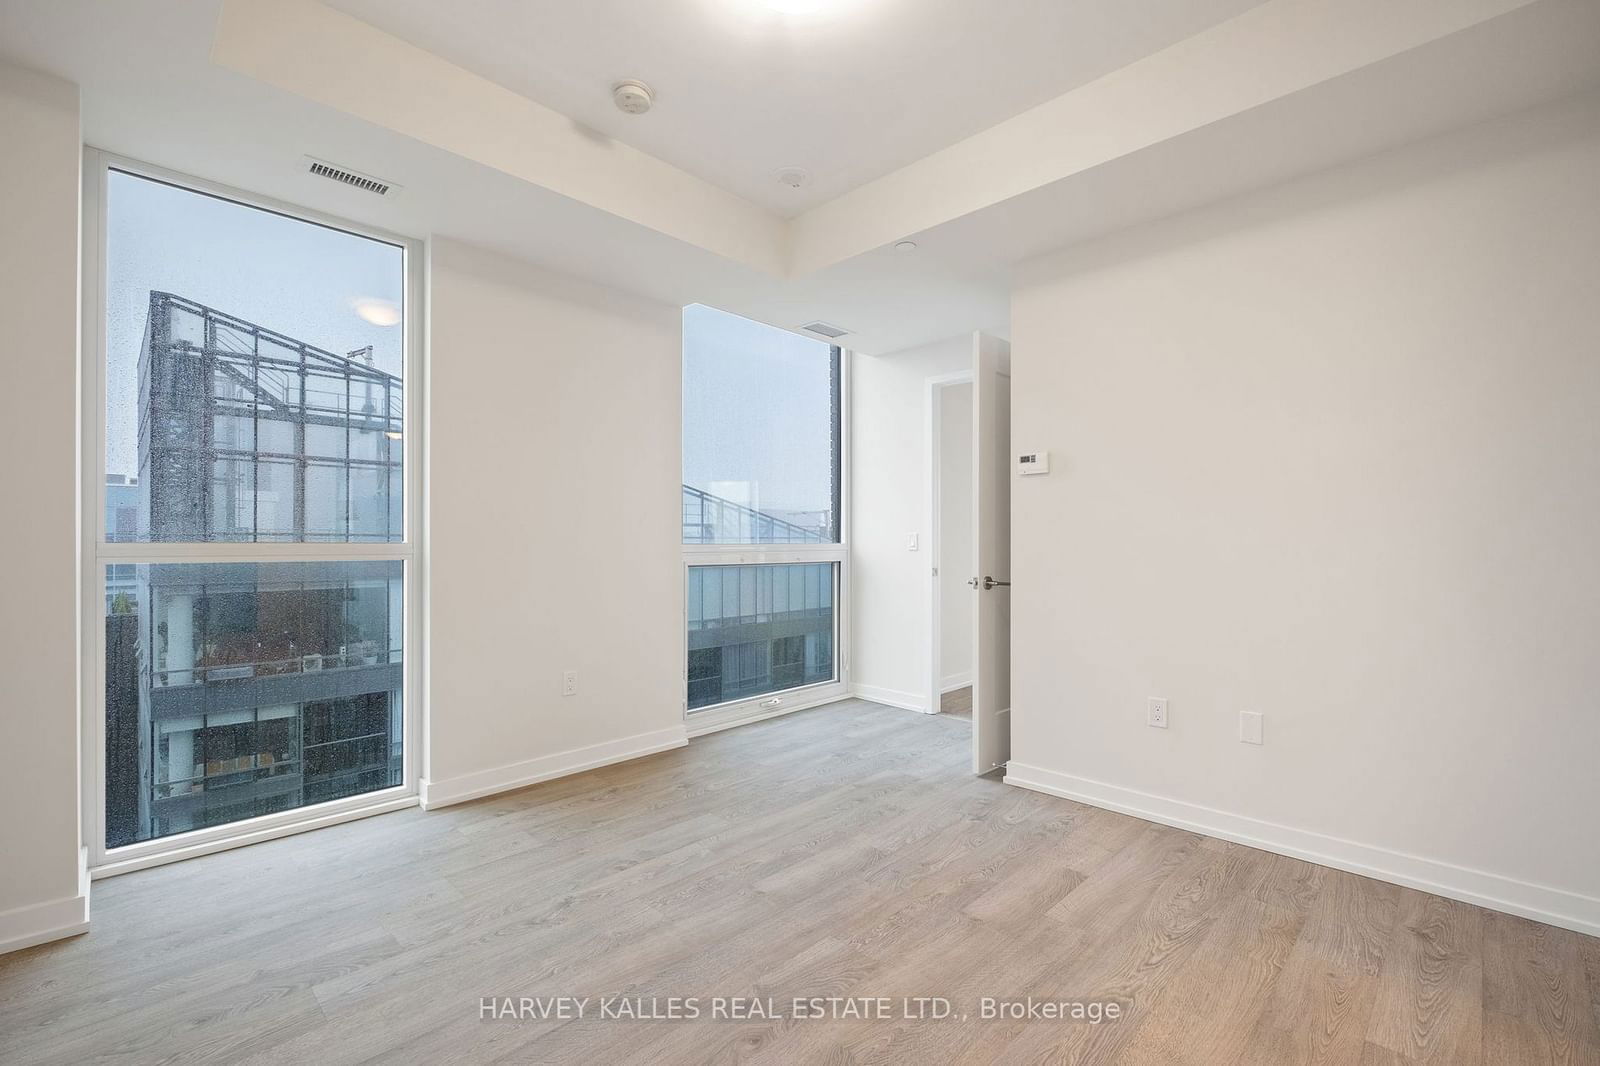
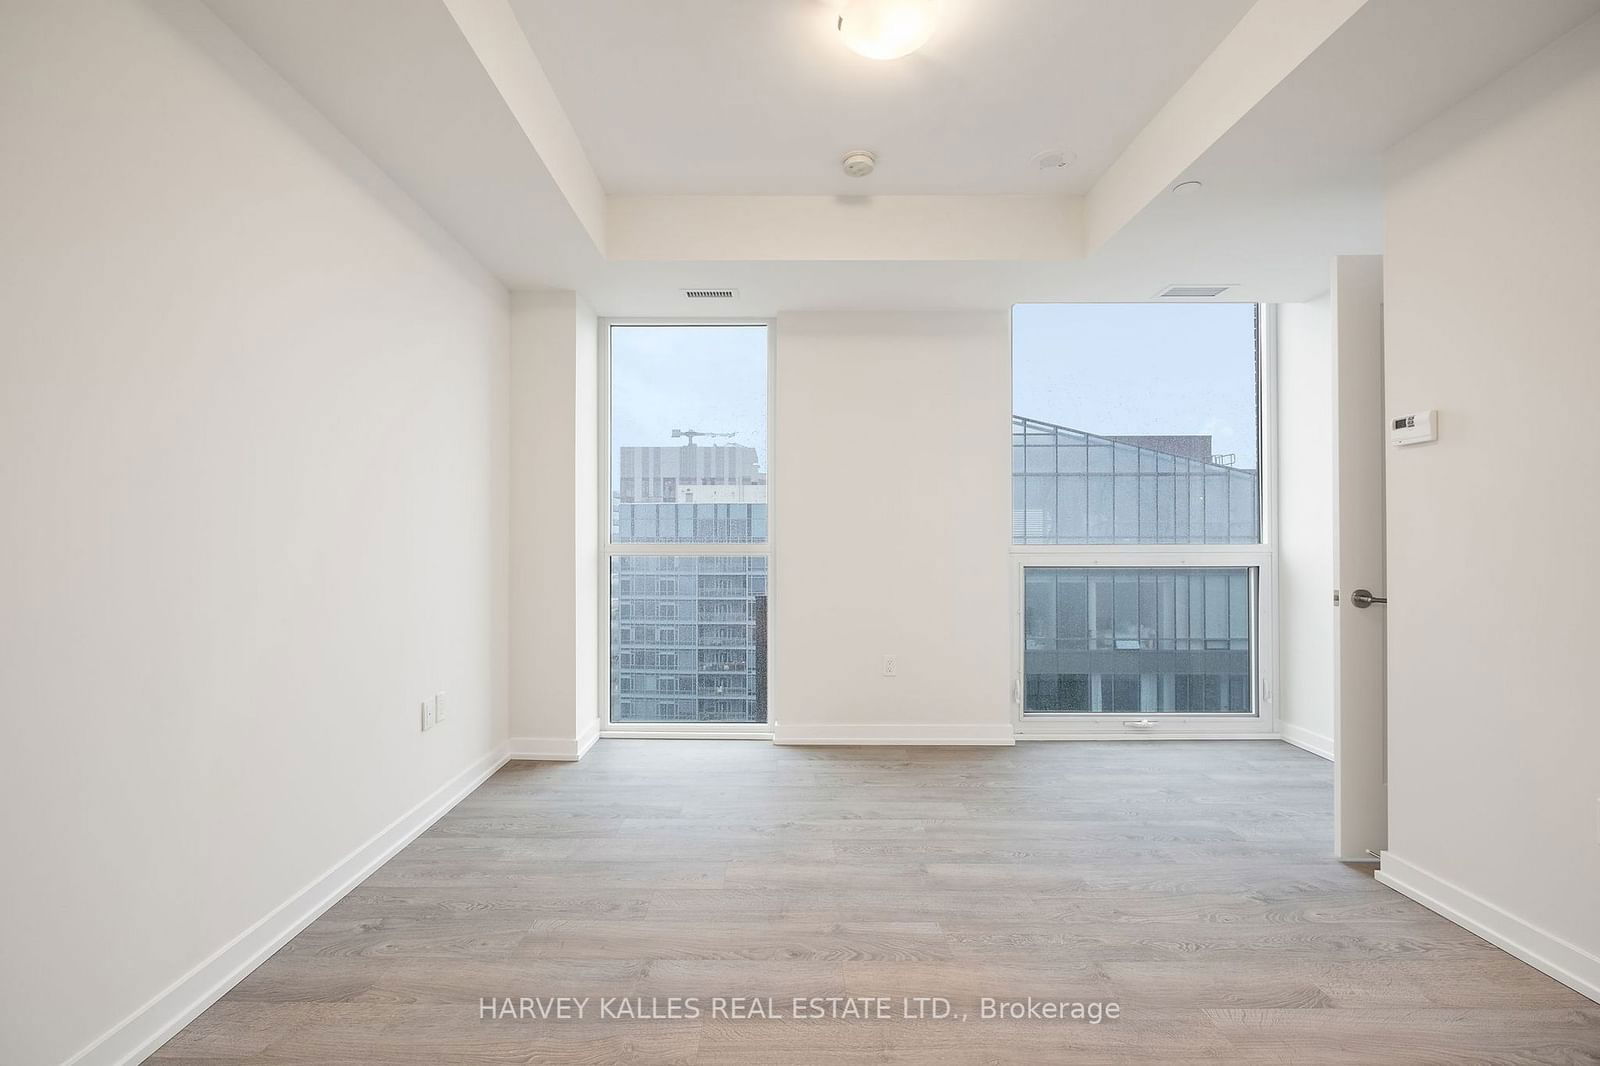
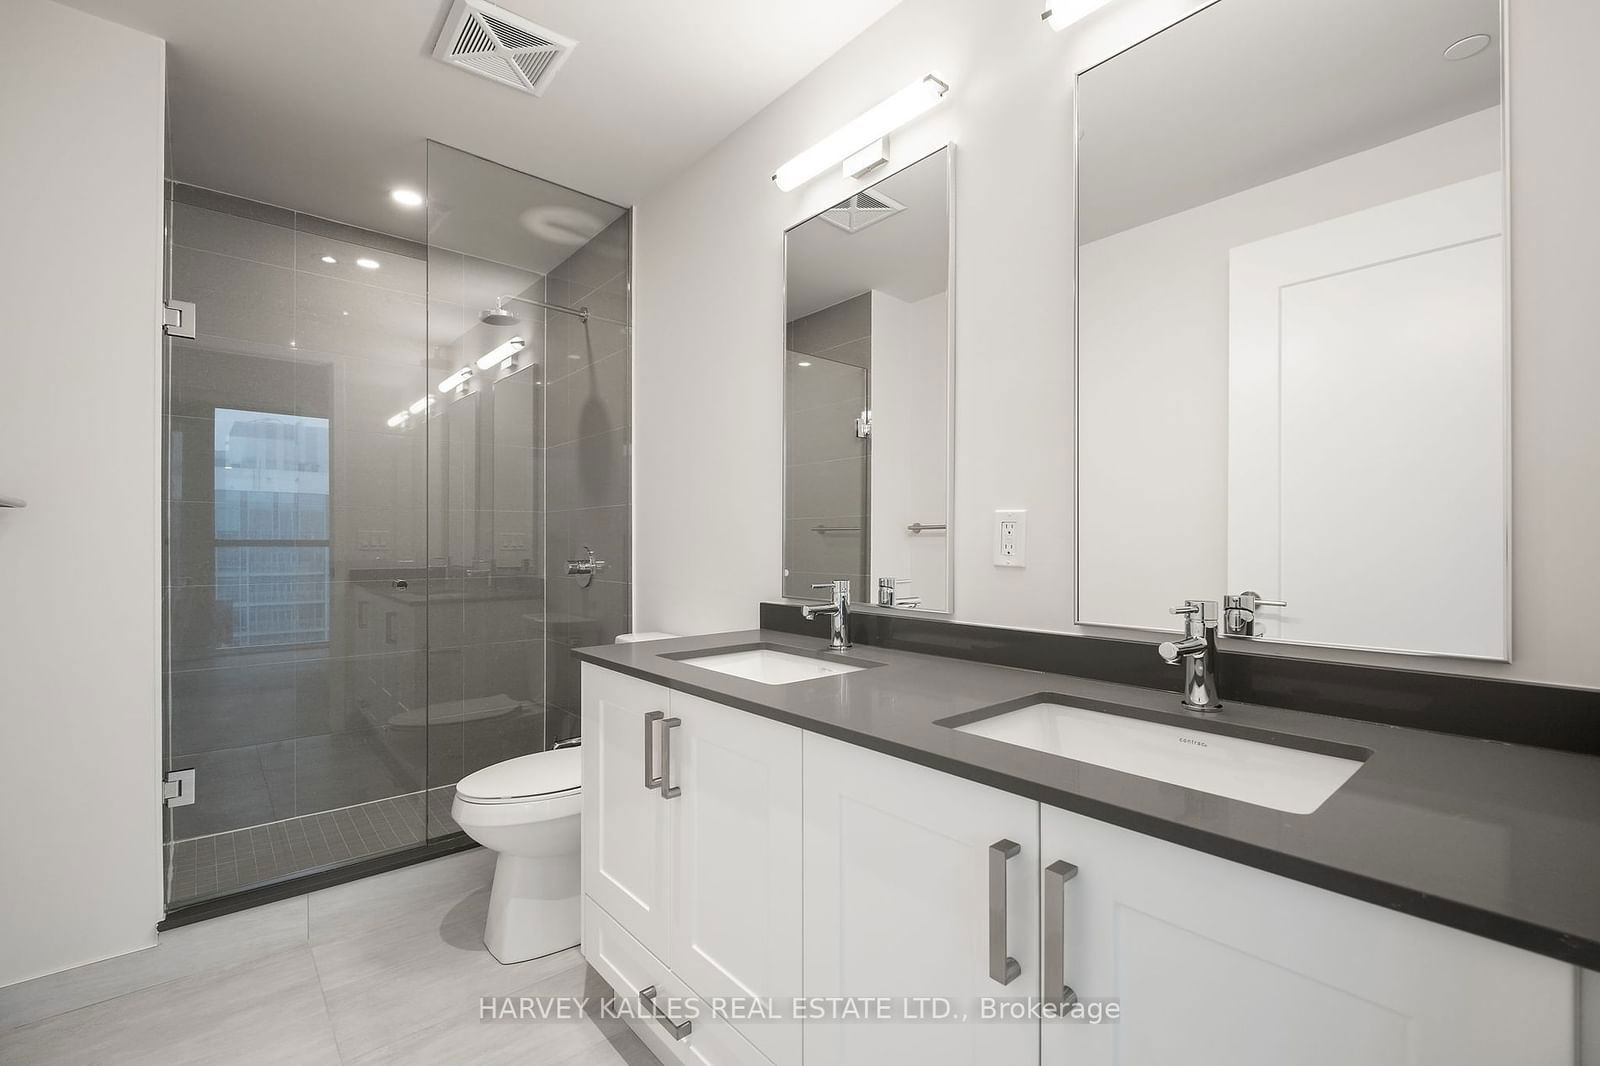
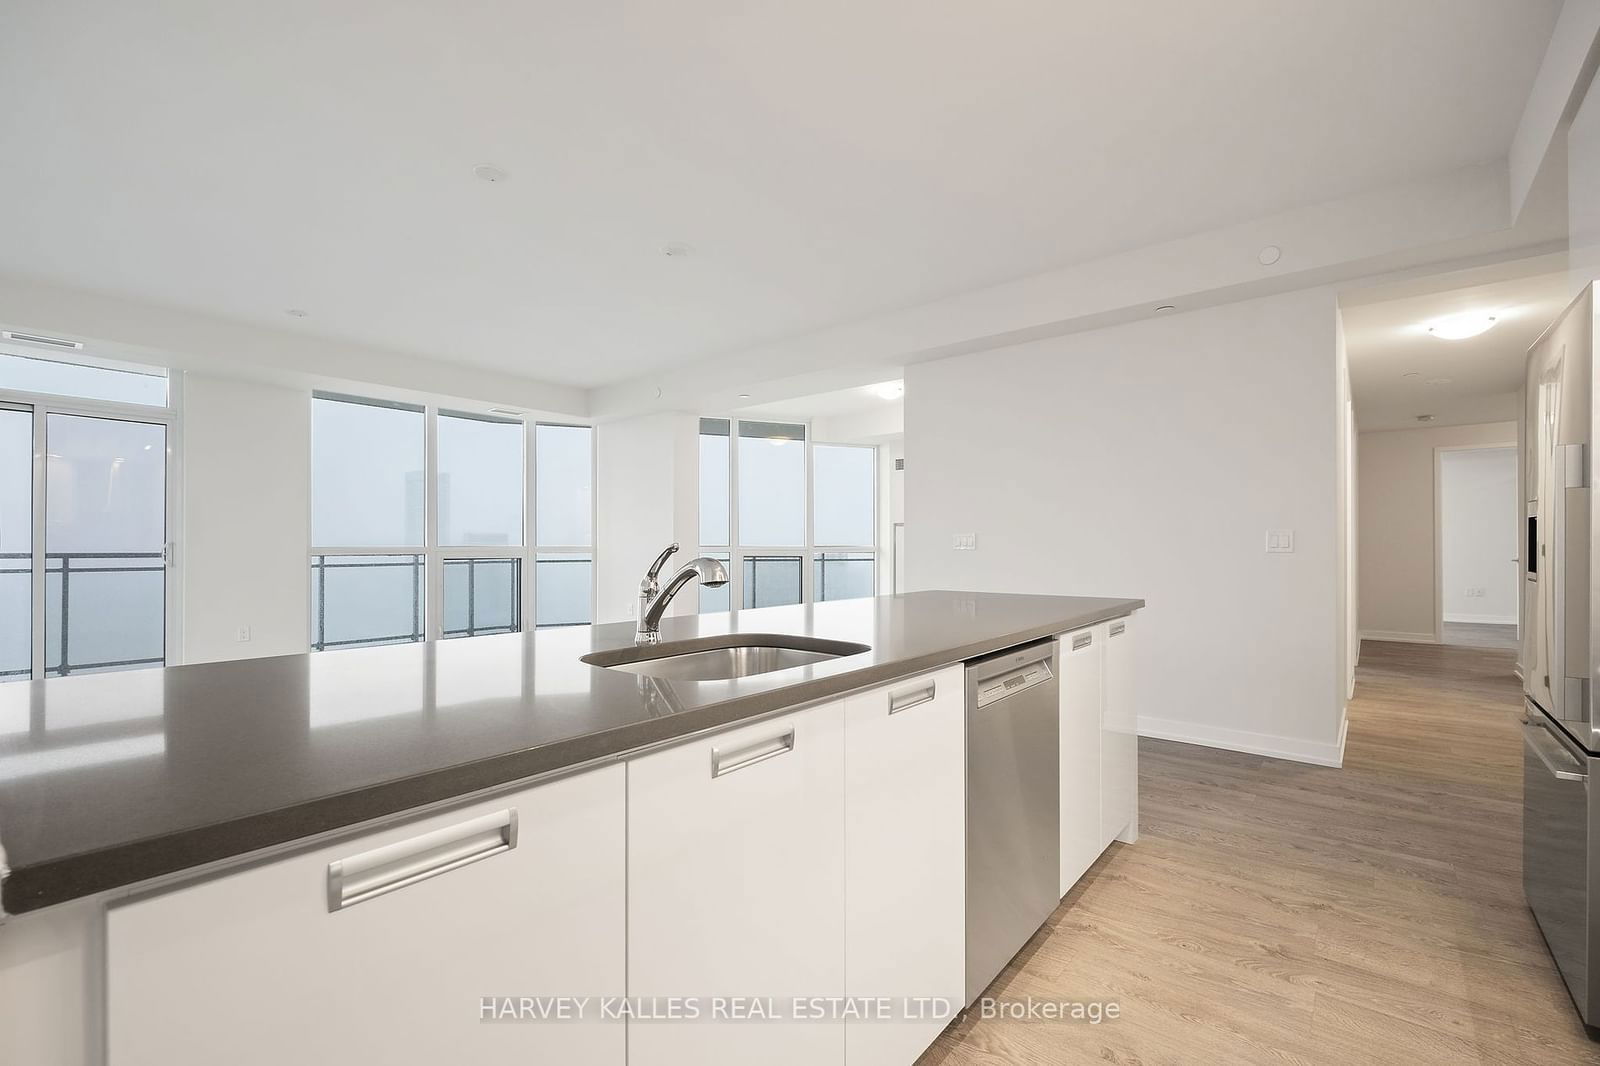
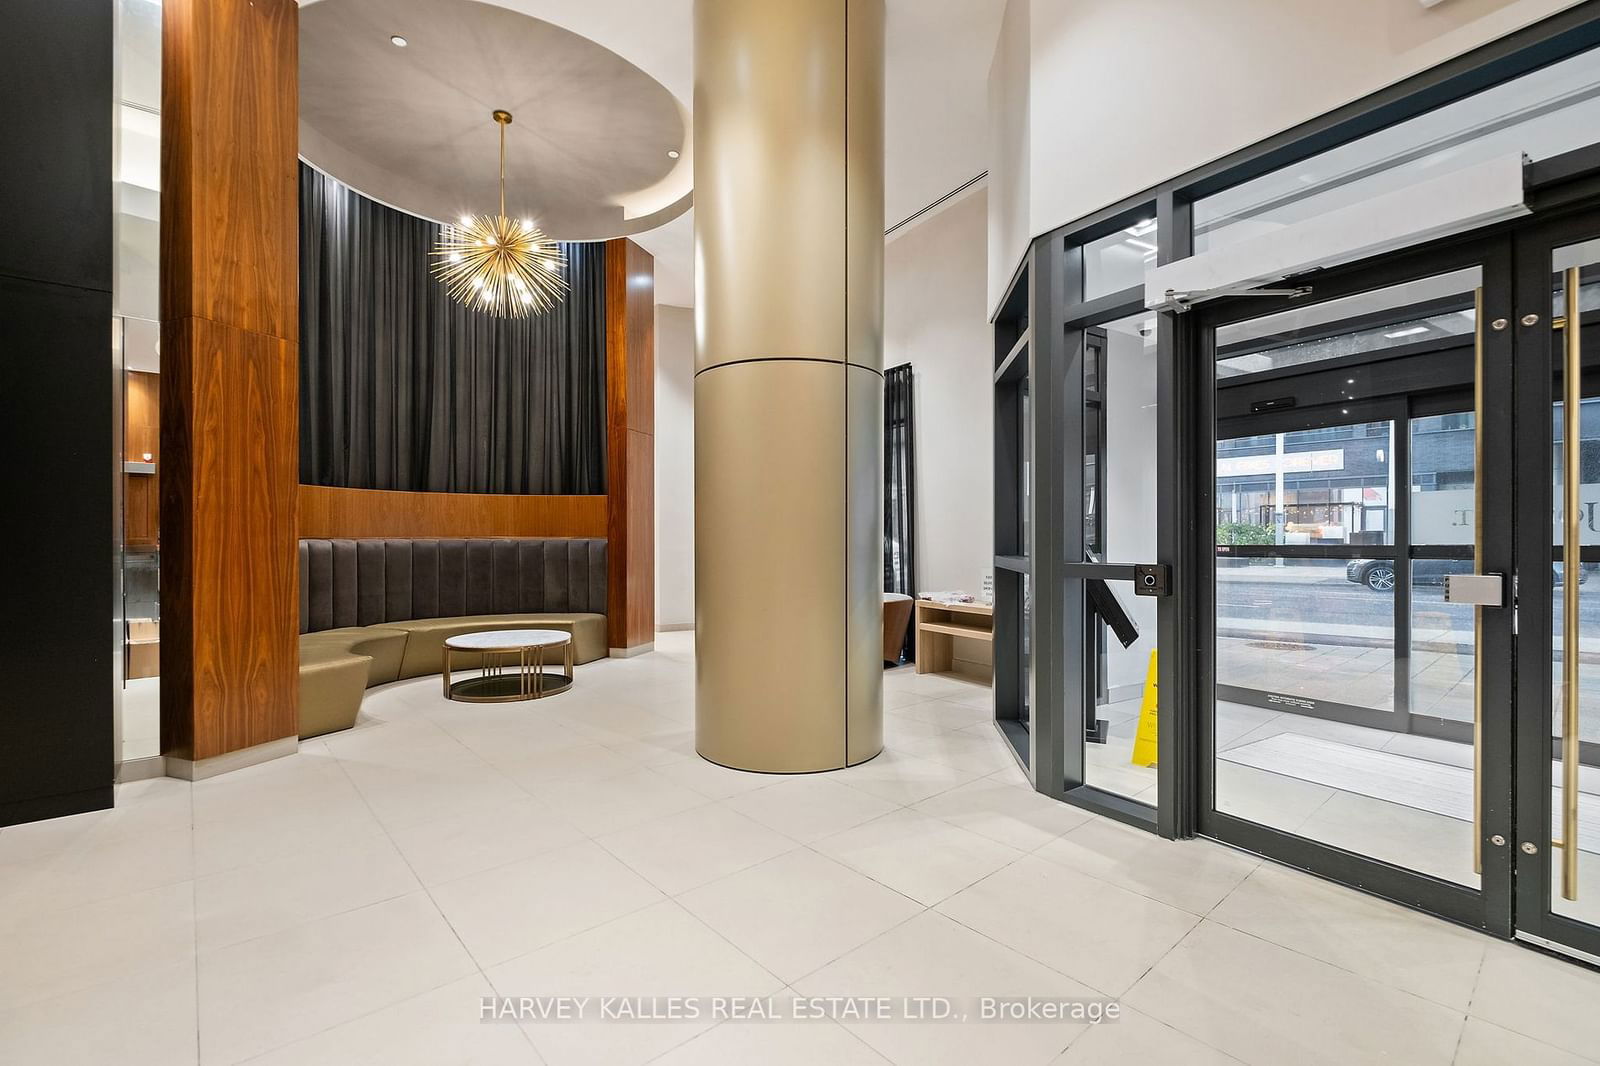
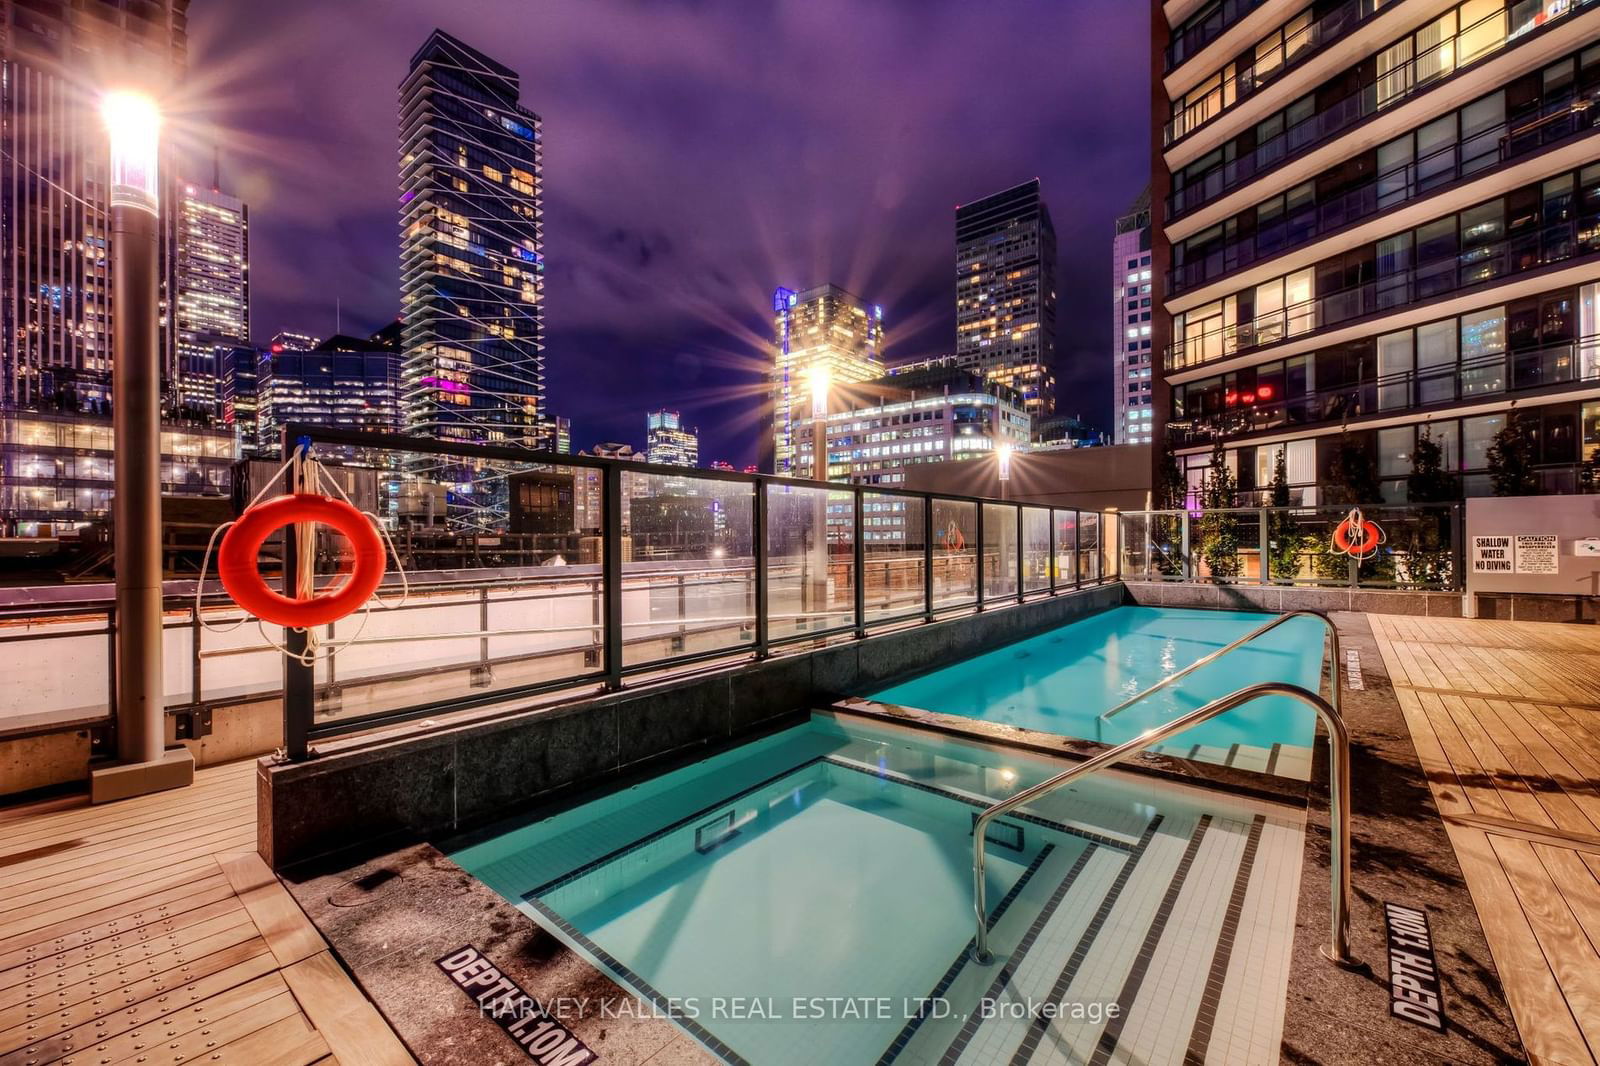
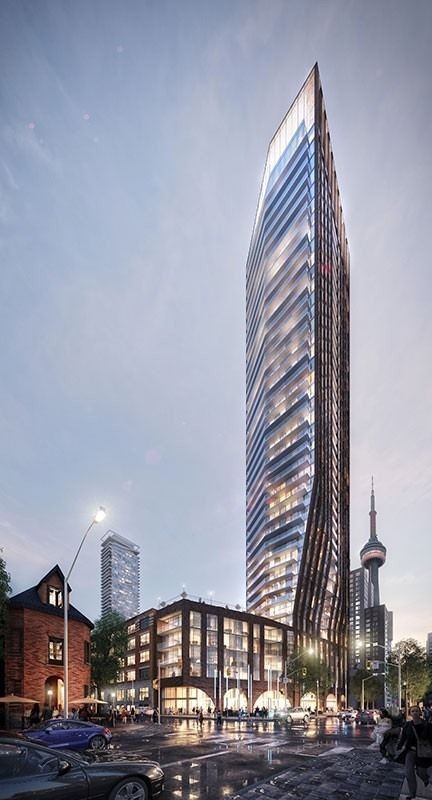
Spectacular views north and west in the iconic PJ Condominium. Beautifully finished 3 bedroom and den Luxury suite. Generous principal rooms and large bedrooms. Great space for entertaining. Kitchen features stainless steel high end appliances, quartz counters, under-mount lighting and designer cupboards. Located in the heart of The Entertainment District. Artistically, one of the most interesting new buildings in downtown Toronto.
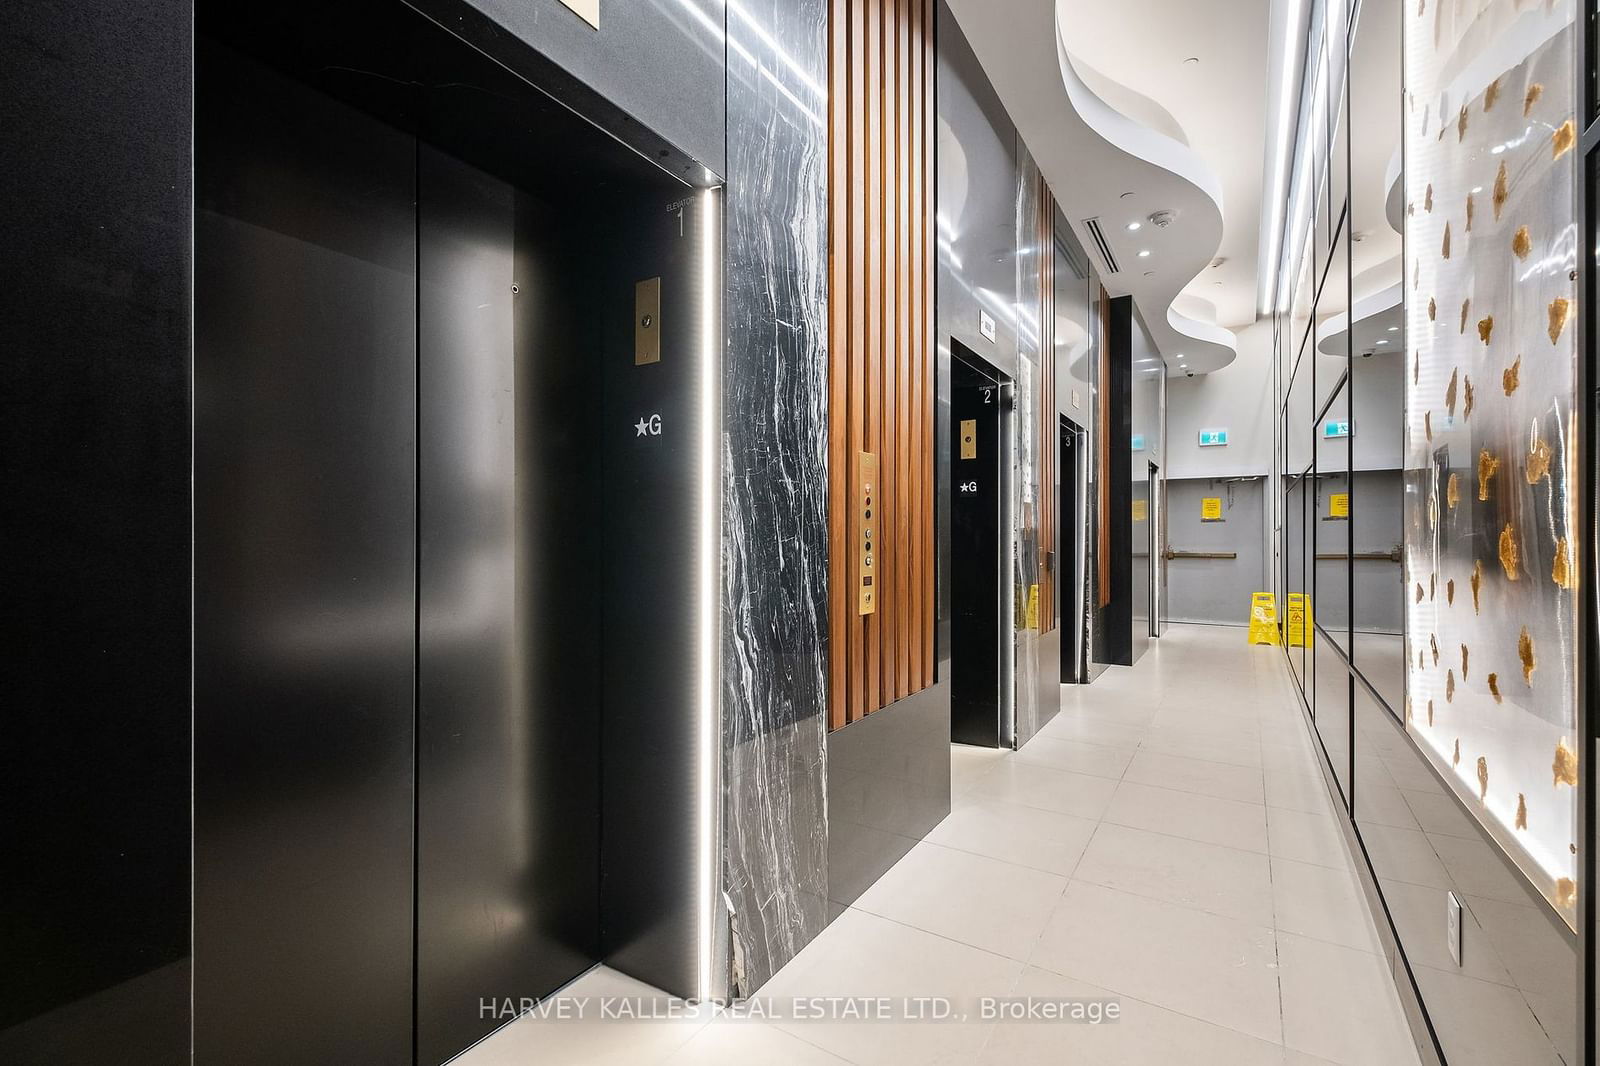
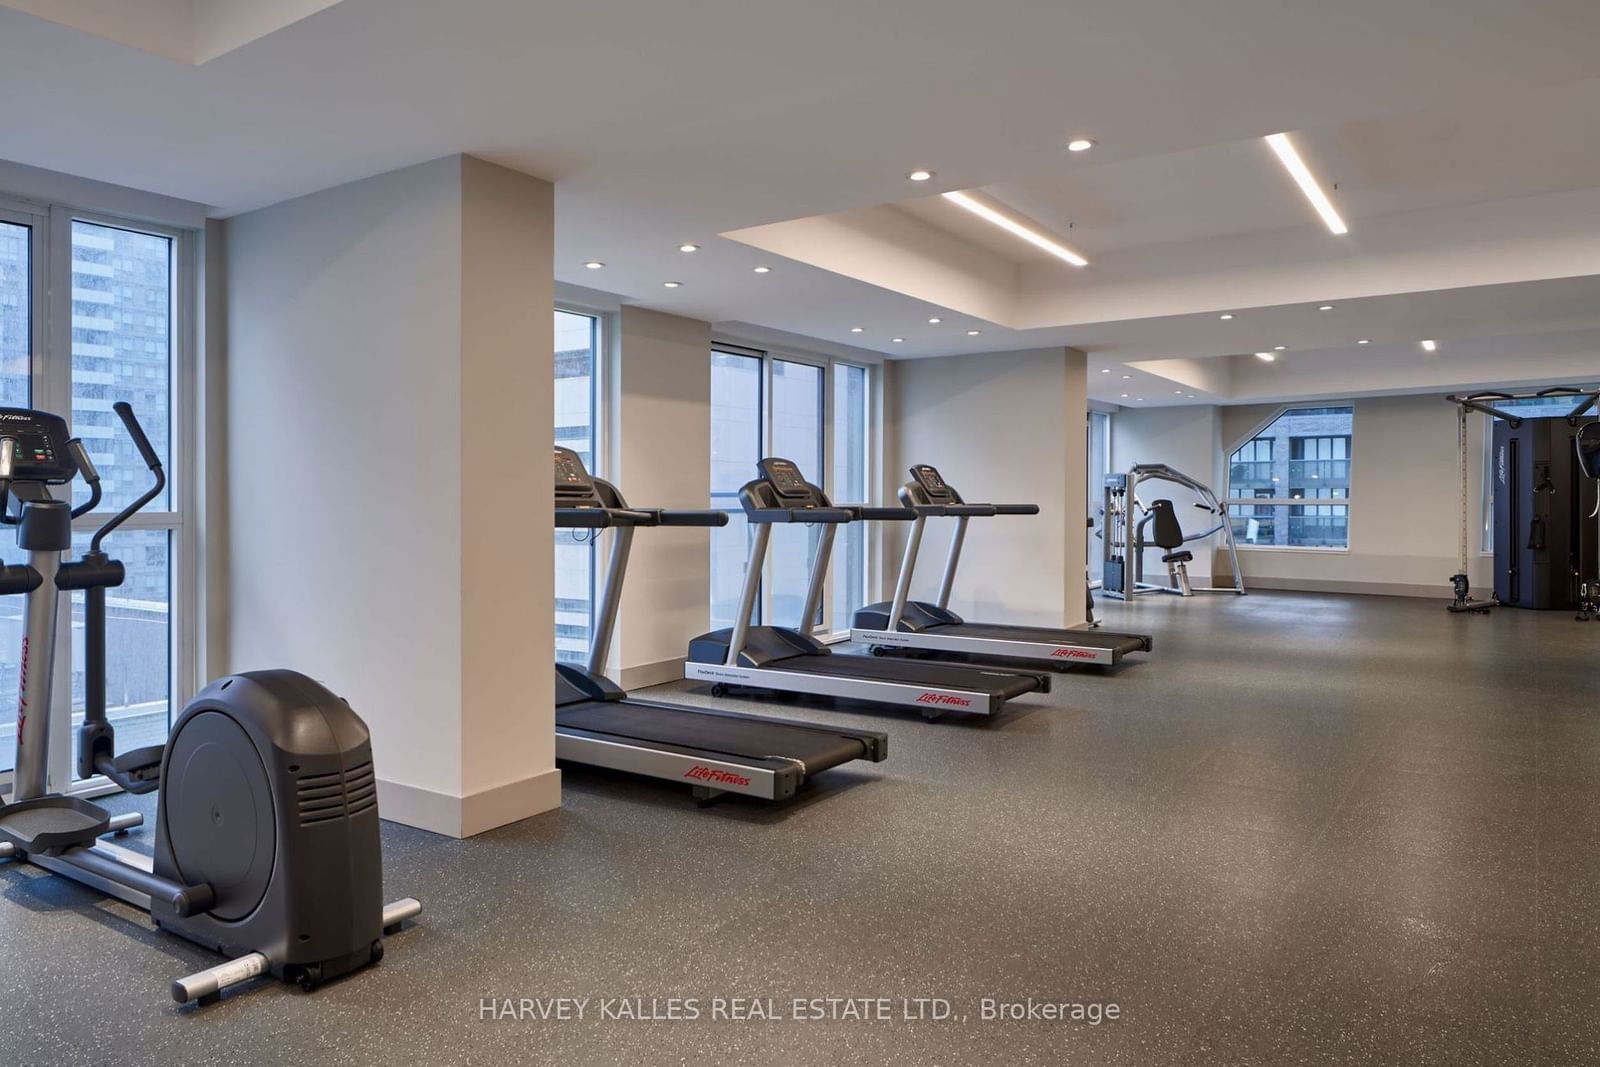
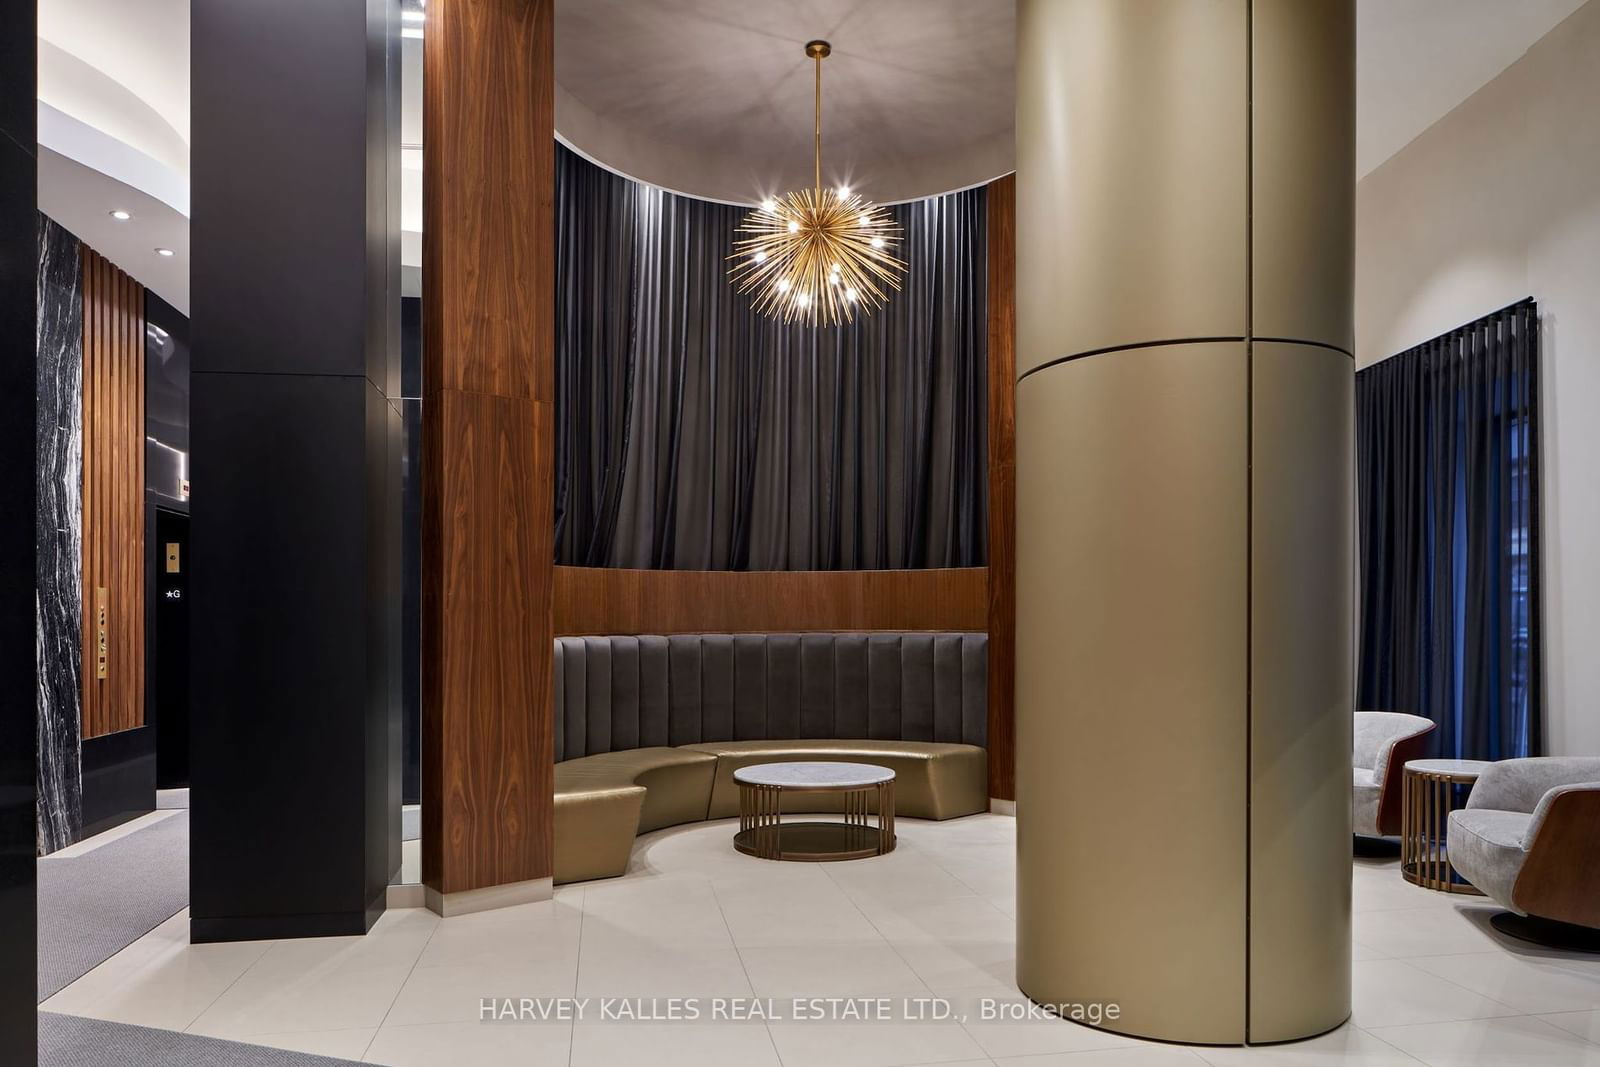
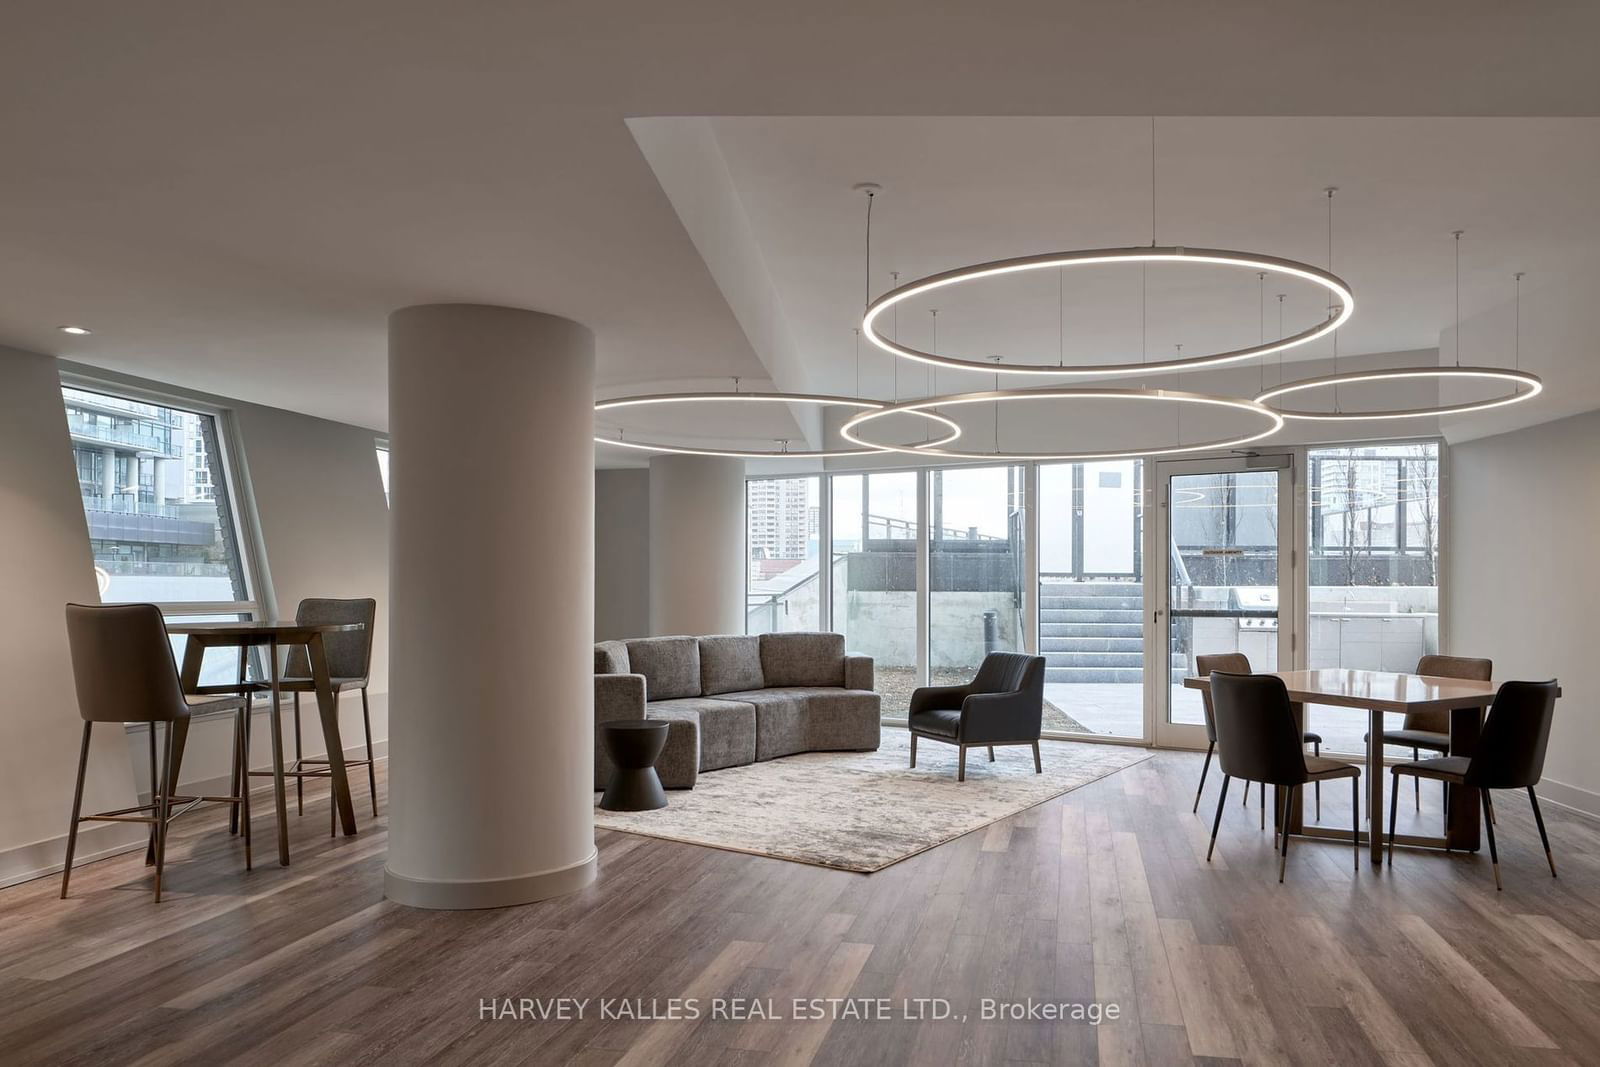
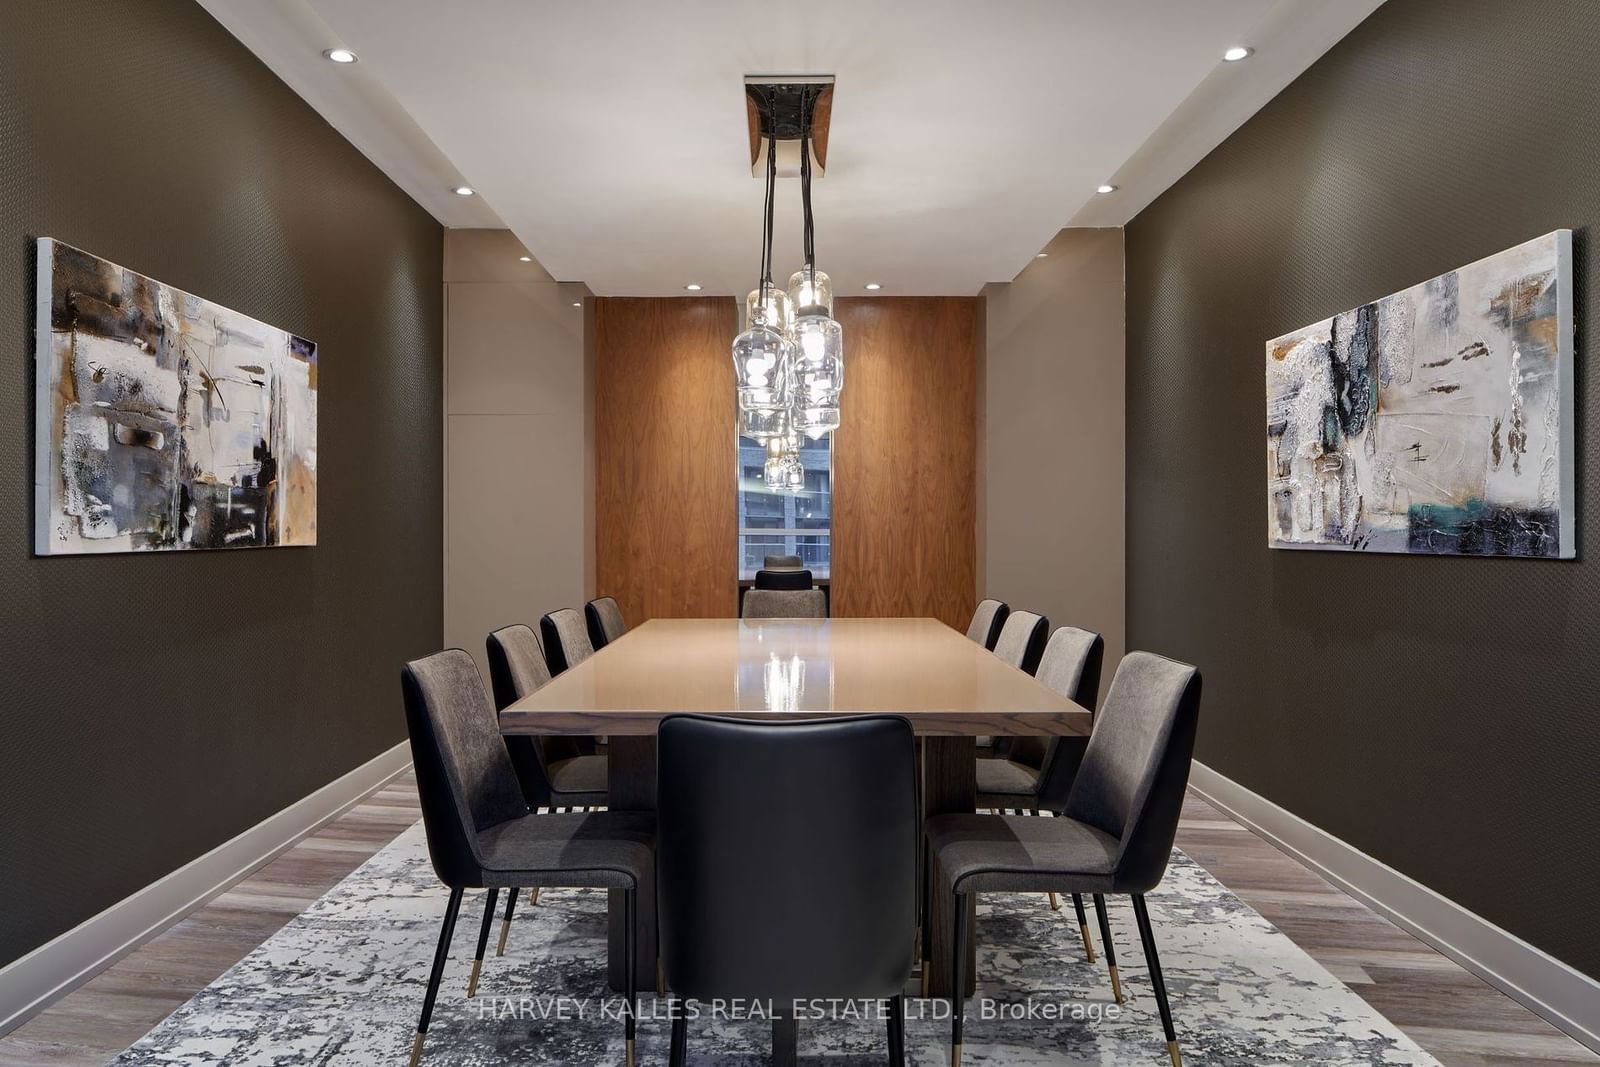
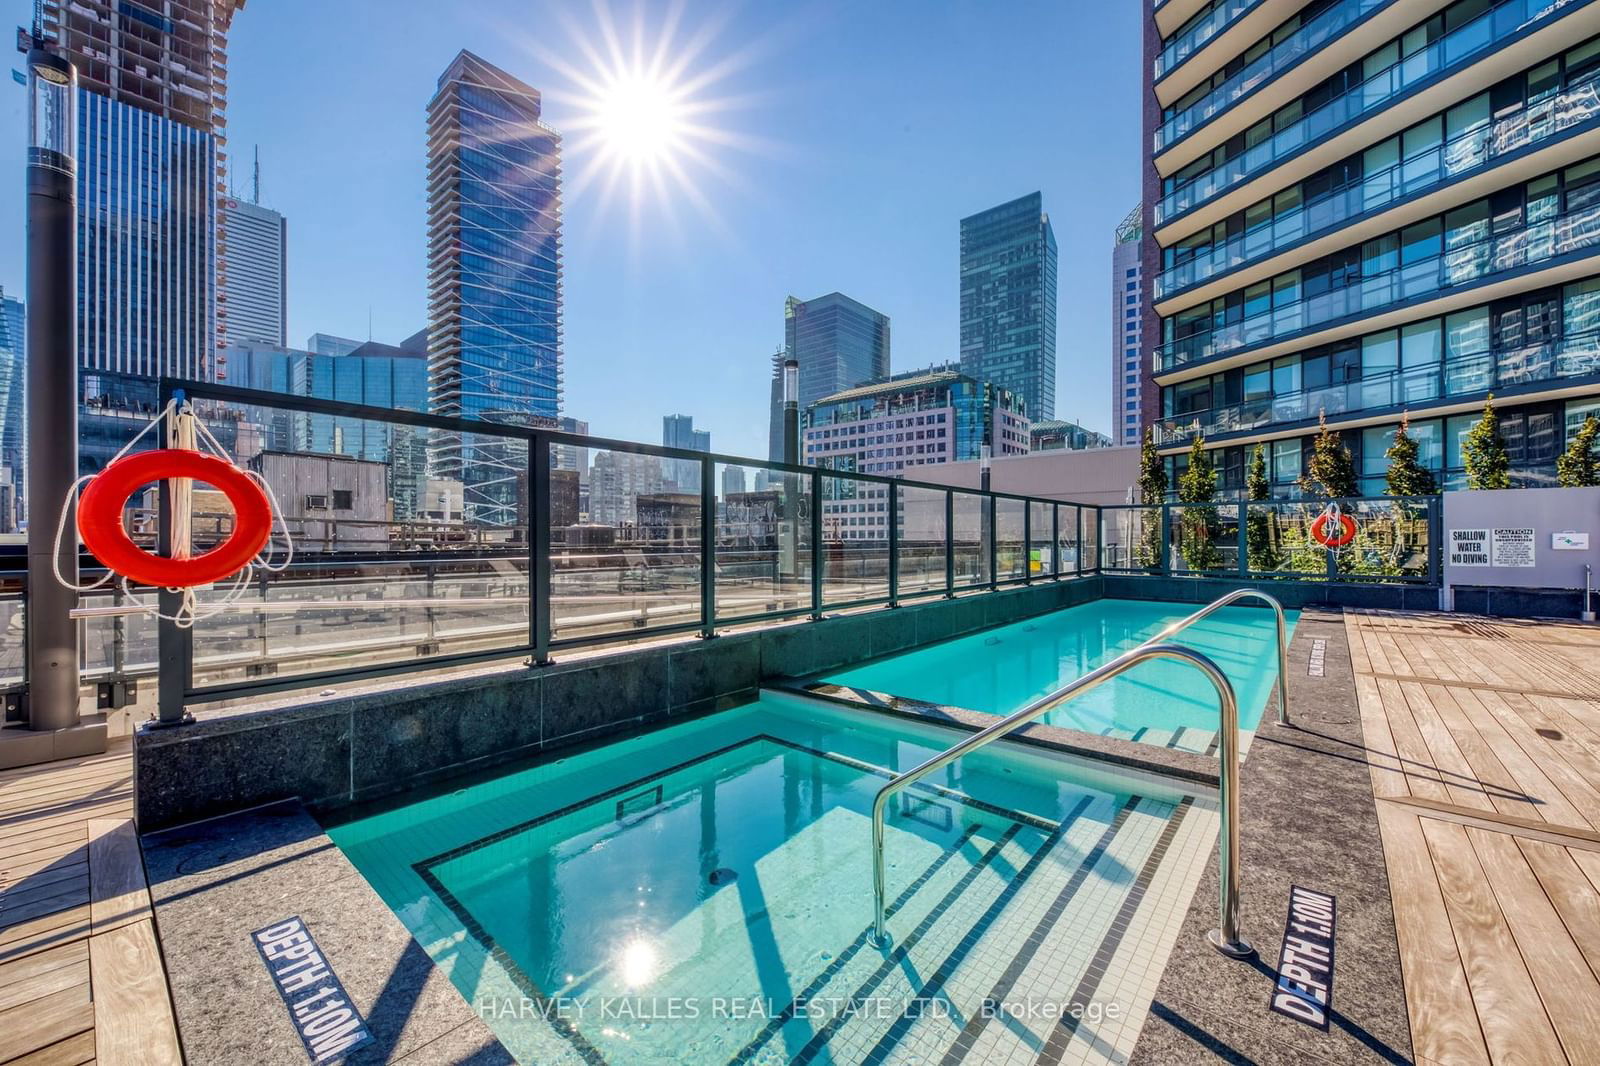
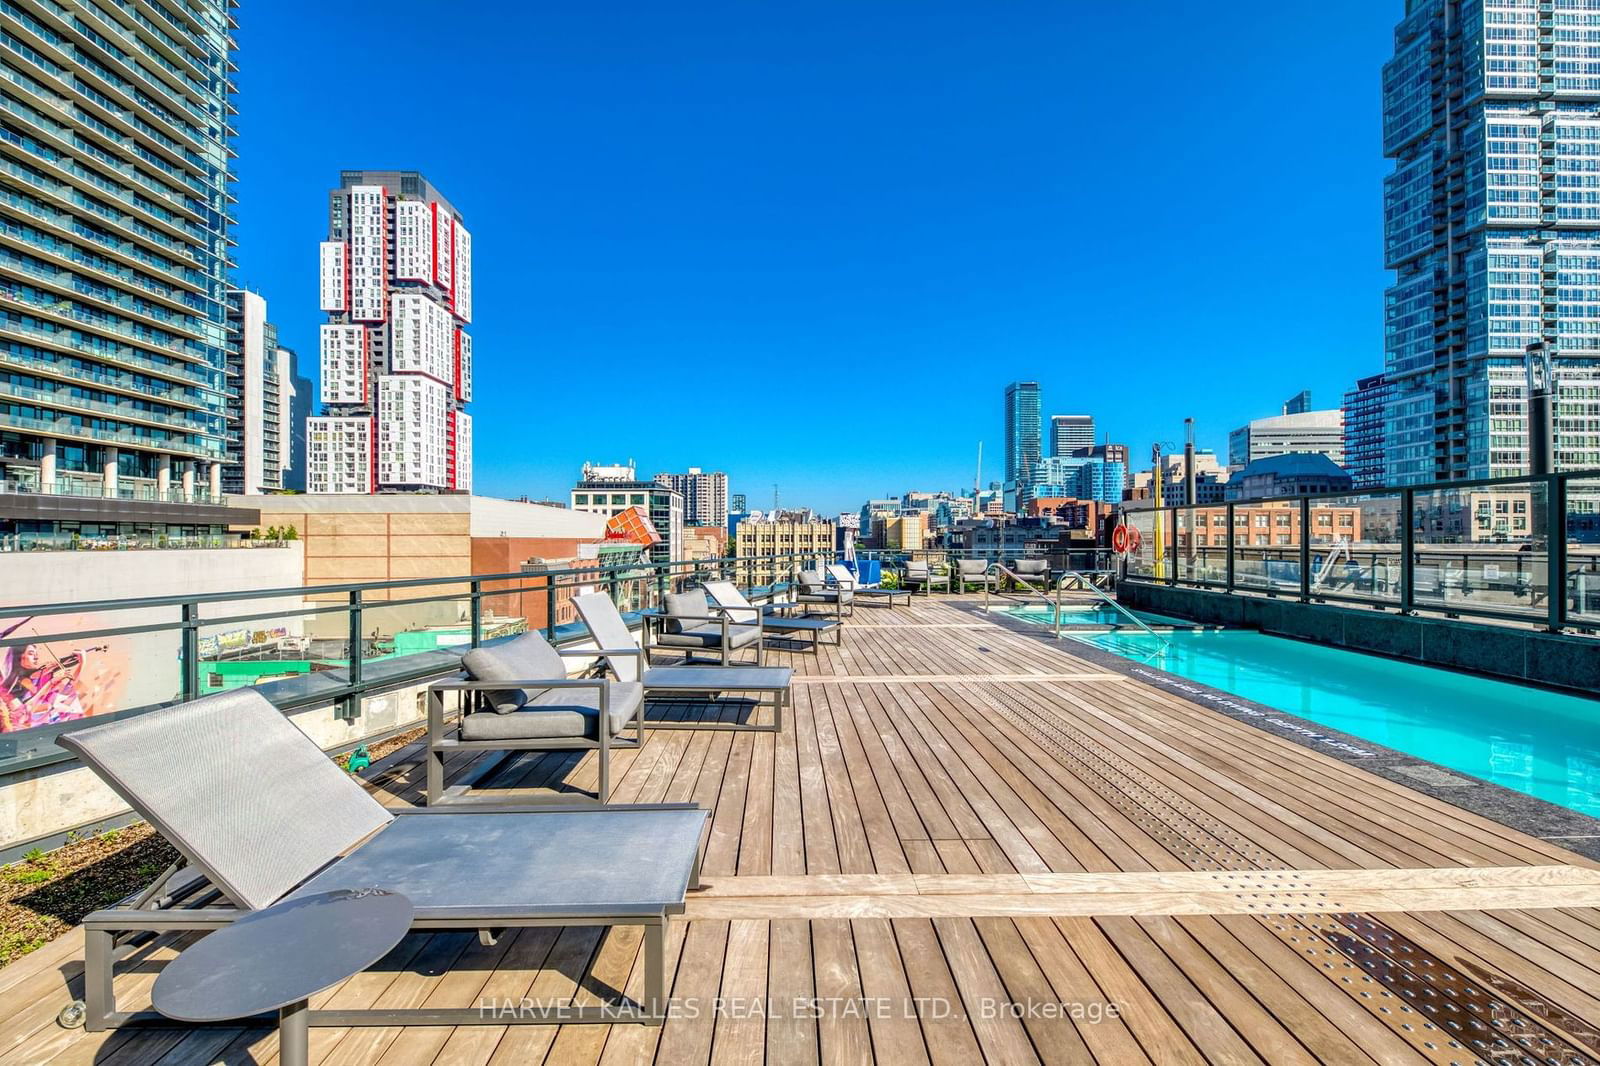
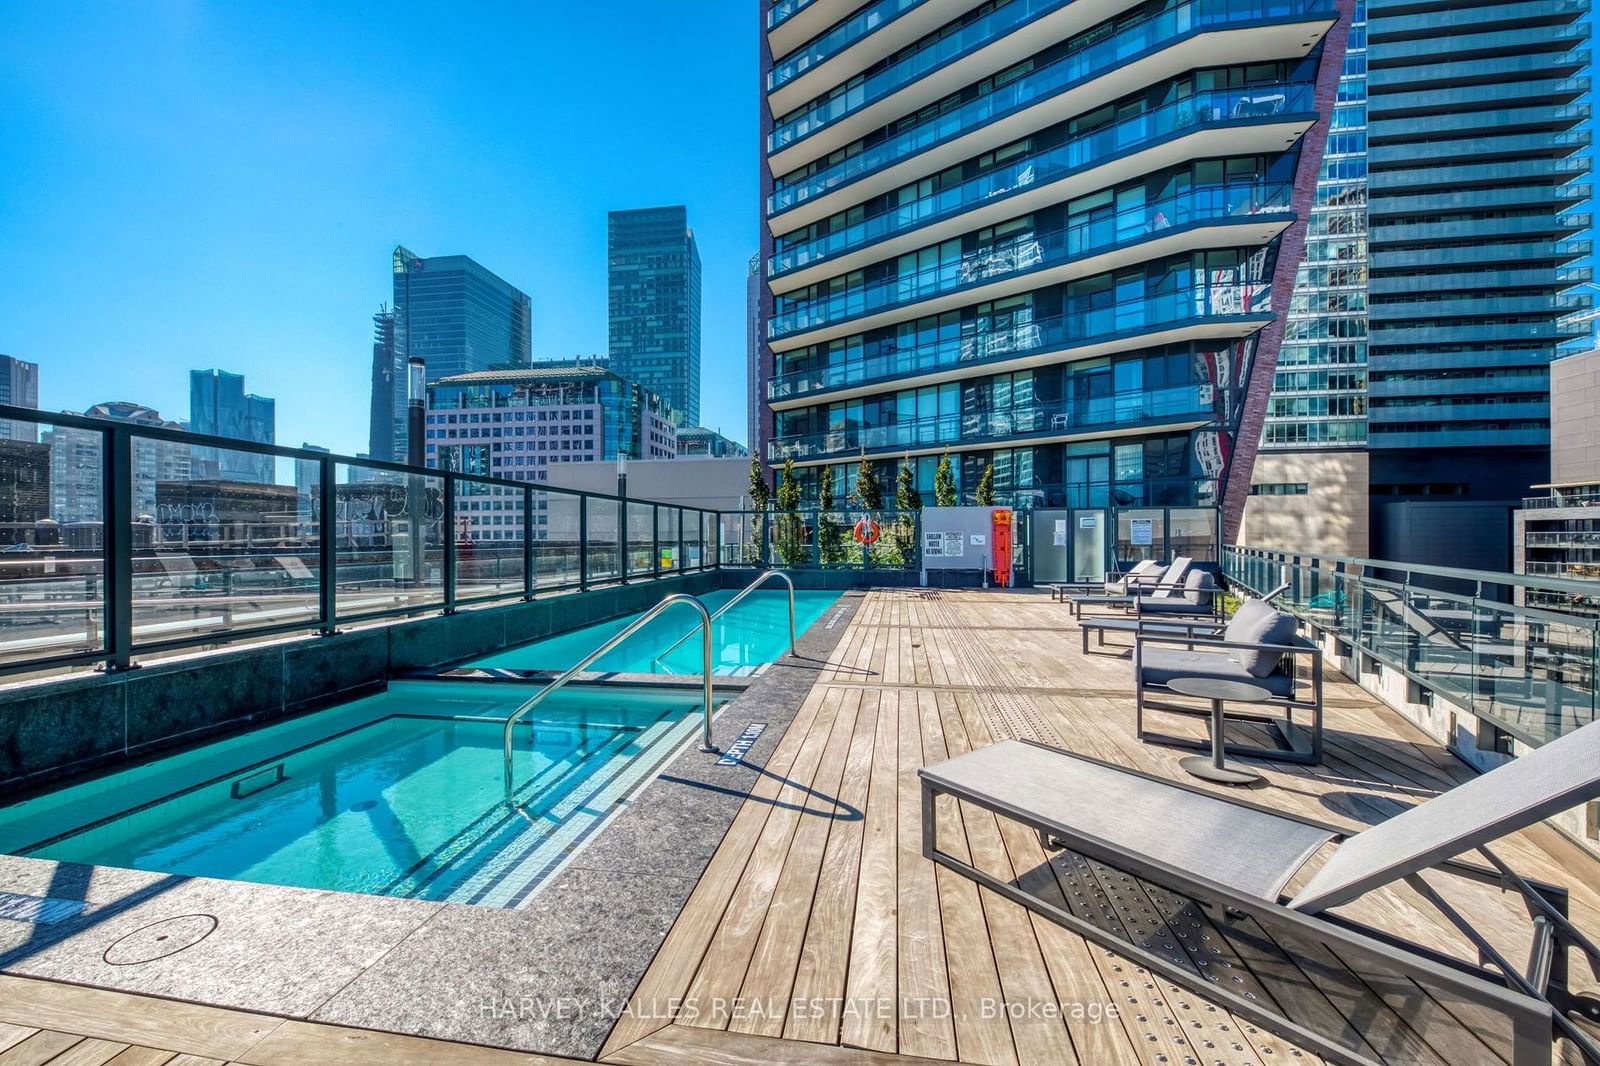
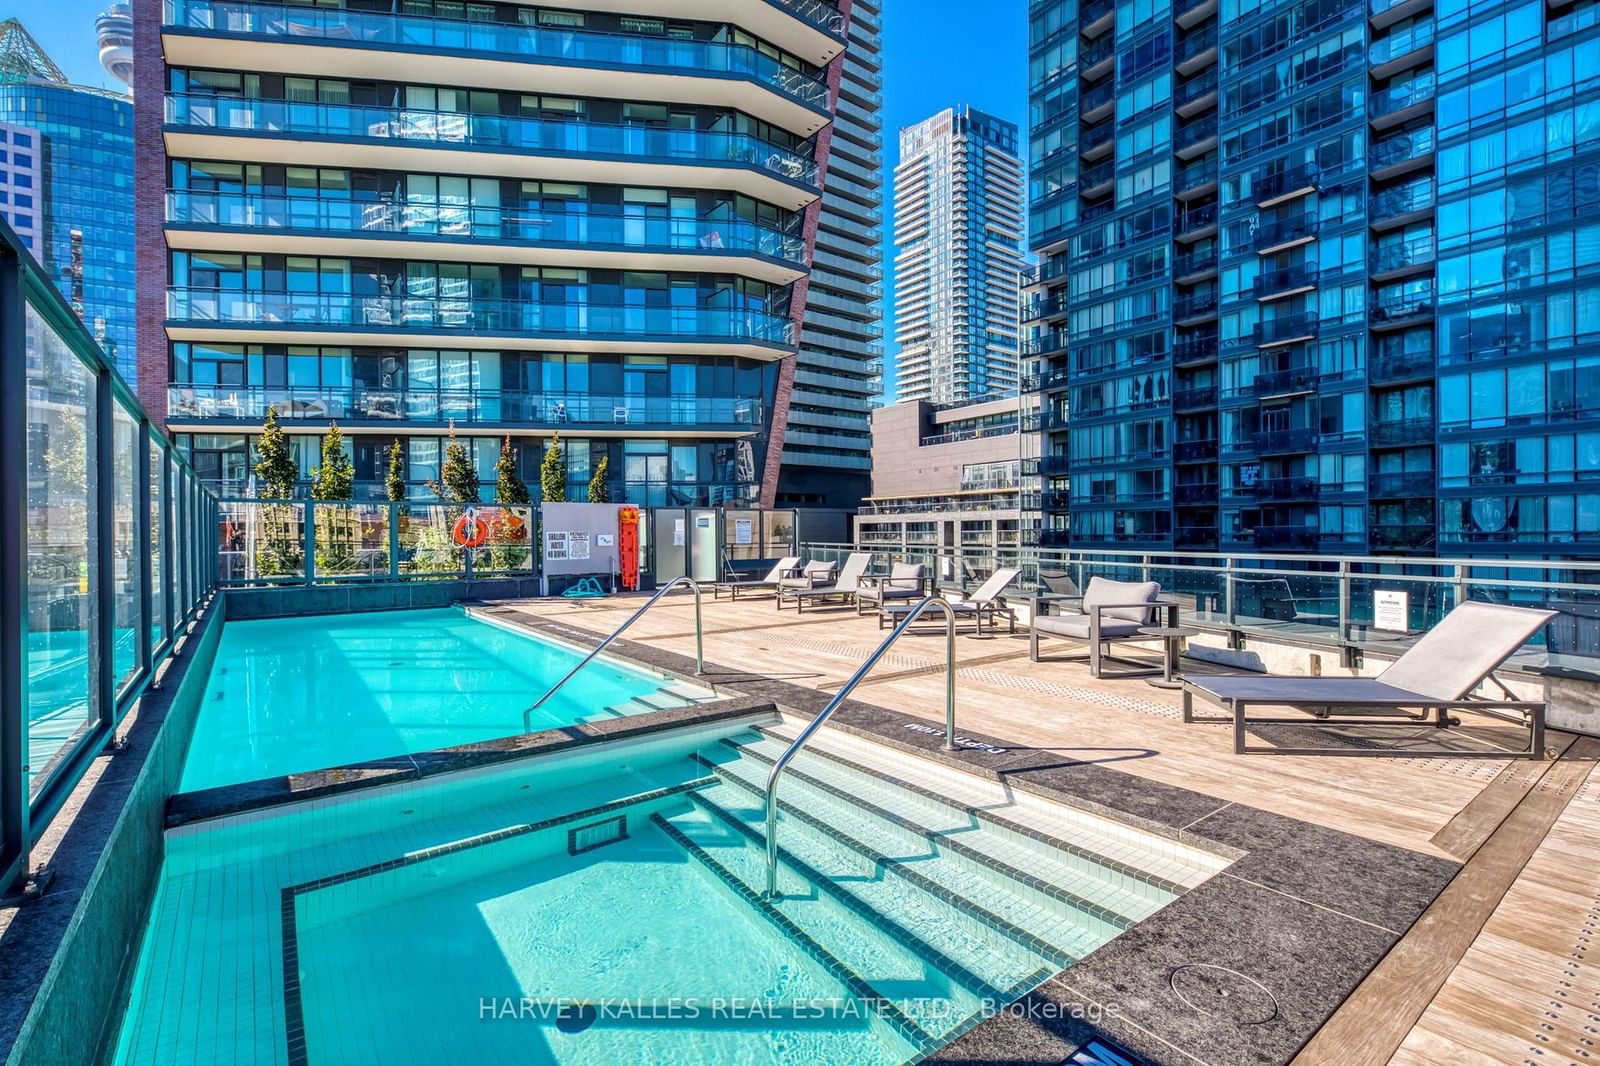
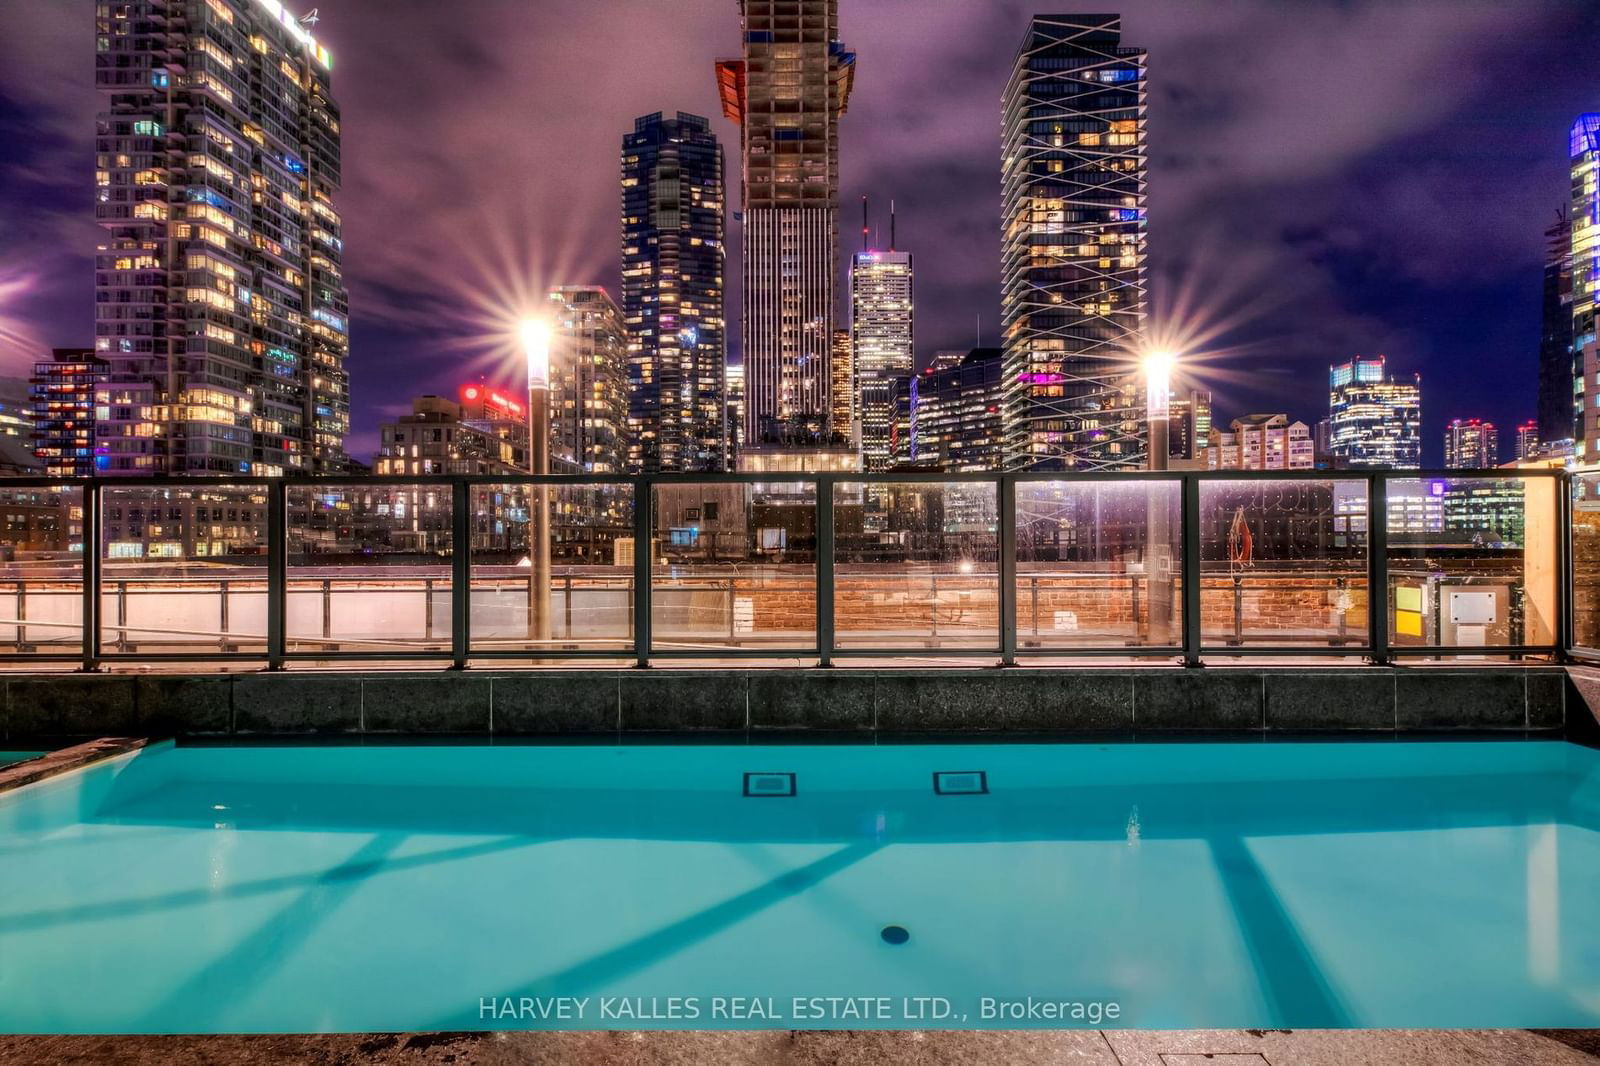
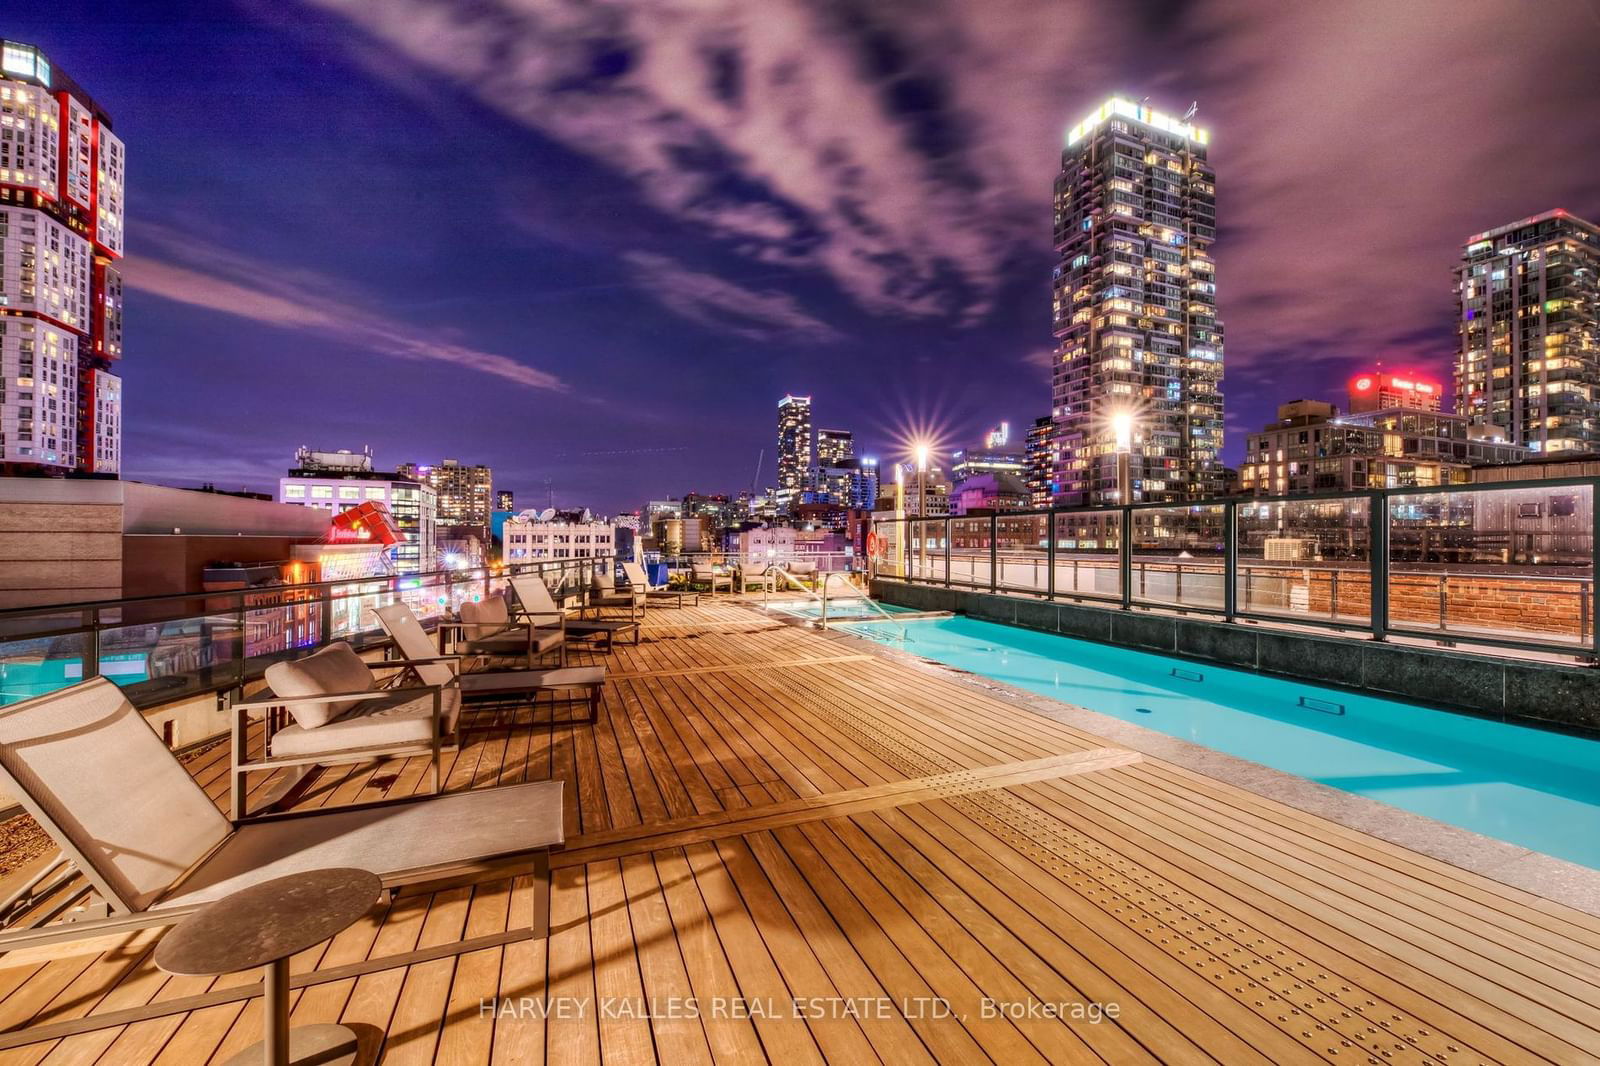
ExtrasGreat amenities including pool and terrace, concierge, gym and party room. Walk to most of the city's best attractions, theatres, restaurants, nightclubs, even walk to Bay St.
harvey kalles real estate ltd.MLS® #C10742590
Building Spotlight
Amenities
Explore Neighbourhood
Similar Listings
Demographics
Based on the dissemination area as defined by Statistics Canada. A dissemination area contains, on average, approximately 200 – 400 households.
Price Trends
Maintenance Fees
Building Trends At The PJ Condos
Days on Strata
List vs Selling Price
Offer Competition
Turnover of Units
Property Value
Price Ranking
Sold Units
Rented Units
Best Value Rank
Appreciation Rank
Rental Yield
High Demand
Transaction Insights at 283 Adelaide Street W
| Studio | 1 Bed | 1 Bed + Den | 2 Bed | 2 Bed + Den | 3 Bed | 3 Bed + Den | |
|---|---|---|---|---|---|---|---|
| Price Range | No Data | $572,500 - $625,000 | $700,000 - $775,000 | $738,000 - $1,030,000 | No Data | No Data | $2,200,000 |
| Avg. Cost Per Sqft | No Data | $1,047 | $1,228 | $1,049 | No Data | No Data | $1,470 |
| Price Range | $1,900 - $2,200 | $2,300 - $2,750 | $1,600 - $3,200 | $2,800 - $3,750 | $3,450 - $3,600 | $3,700 - $4,000 | $4,750 |
| Avg. Wait for Unit Availability | No Data | 512 Days | 294 Days | 335 Days | 2442 Days | No Data | 1379 Days |
| Avg. Wait for Unit Availability | 33 Days | 29 Days | 14 Days | 19 Days | 119 Days | 236 Days | 389 Days |
| Ratio of Units in Building | 11% | 16% | 39% | 23% | 5% | 3% | 6% |
Transactions vs Inventory
Total number of units listed and sold in King West
